SP500 Analysis – Target reached and secured
Now, piece about the SP500. The price reached our long-term target about which we are talking about for the past few weeks. It did not come so easily though. Previously, we mentioned the SP500 on the 10th of December, when we had a bearish breakout:
“Breakout the the downside is a technical invitation to sell. Price coming back above will mean a false breakout and will be a technical invitation to buy but chances for that are limited. Where is the Stock Santa by the way? „
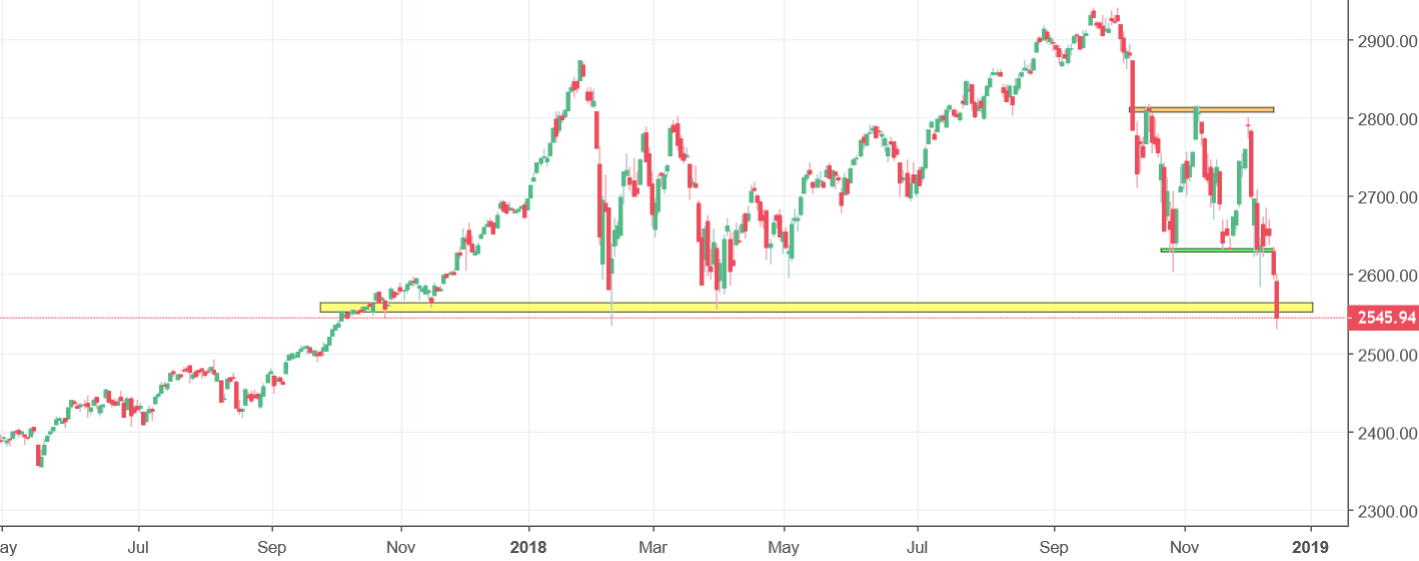
The breakout was false! Well, at least for the first few days, The price went back above the support but it did not last long. Sellers attacked again and yesterday reached our long-awaited target – 2550 points (yellow). If you think that from this place, the Santa rally will start, think again. I think he should be here by now. Reaching this point may be rather a signal of capitulation than a great trading opportunity. May be a sign that something snapped and we are literally heading towards the recession. How long can we ignore some signals from the economy and how long can we push the stock prices higher using freshly printed money? As for now, the sell signal remains intact, buyers can think about buying only after the price will come back above the green resistance.


Comments (0 comment(s))