SP500 Analysis – What’s next?

The last instrument in the technical part in our feed is the SP500. For the last time, we talked about this instrument on the 30th of October, when the price was sharply going down. Despite the heavy losses, we saw a chance for a bullish reversal. That is what we wrote back then:
“Currently, the price is making a correction equality pattern (blue), so the current drop has a similar depth to this one from the beginning of the year. That can be an occasion for a reversal but I think that we should go as deep as to the yellow horizontal support around 2555 points. „
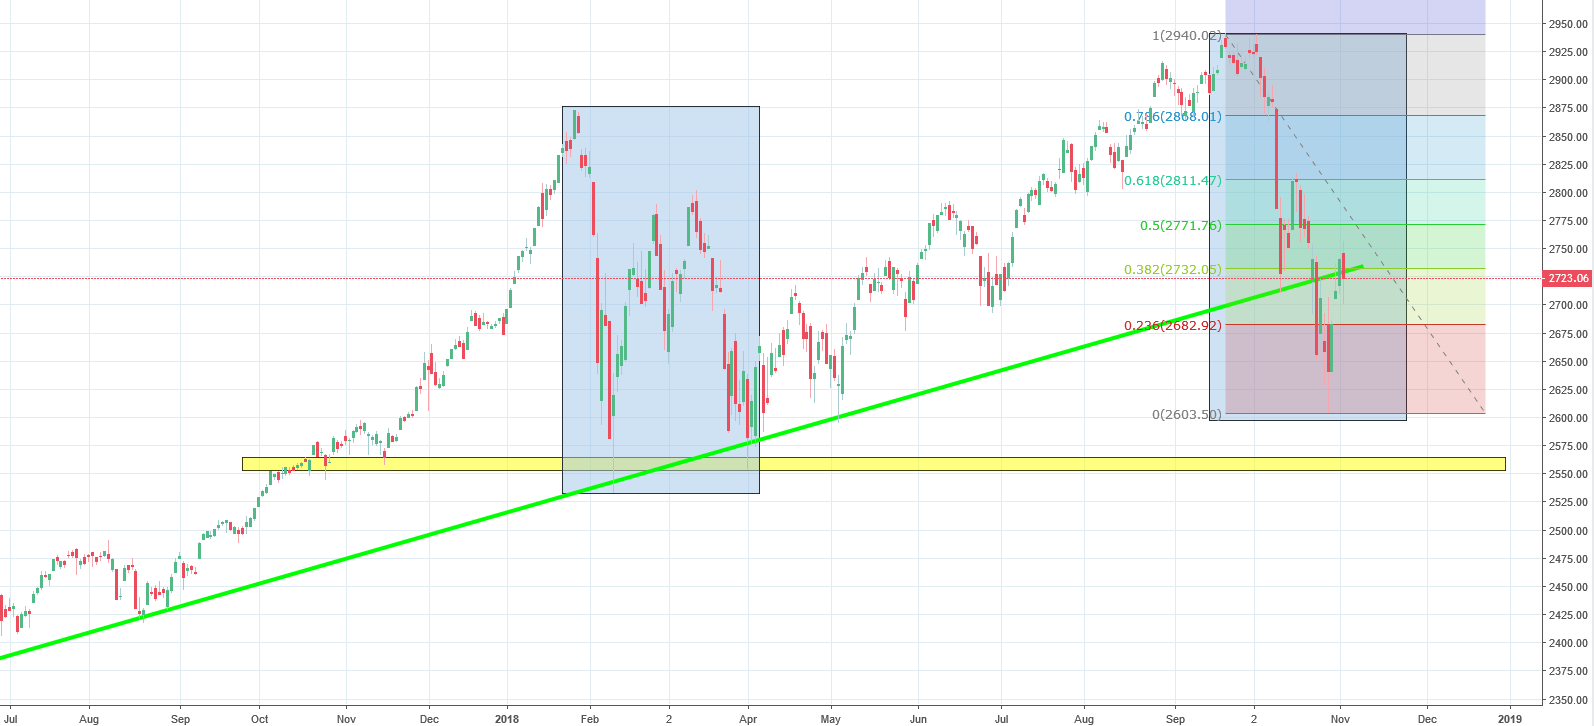
Yes, the correction equality pattern worked! The price used that as a trigger to go the other way. The bullish correction was not deep though. Actually it was quite typical as it stopped on the 38,2% Fibonacci. This is where the buyers gave up and allowed the sellers to create a strong bearish candle. Situation is still promoting a further slide. Similar setup happened here at the beginning of the year. As you can see, the slide was stopped for a while but after some time, the price made new lower lows. This can happen here too. In my opinion, the next few weeks should be negative.


Comments (0 comment(s))