WTI Oil Analysis – Finally a trading signal…

Now, time for Oil, where we finally received a proper trading signal. For the past few weeks, the price was closed inside of the symmetric triangle pattern. In addition to that, we had two H&S formations. One was classic and second one was inverse. On the 17th of September, we wrote this:
“That all looks fine but buyers have their own pattern too and that is an inverse head and shoulders (pink neckline). Smaller one but potentially efficient. Anyway, as it always is with the triangles, we need to see the breakout of the upper or lower line first. That will be only the first step though. The major signal will be triggered, only when the price will break one of the necklines mentioned above. „
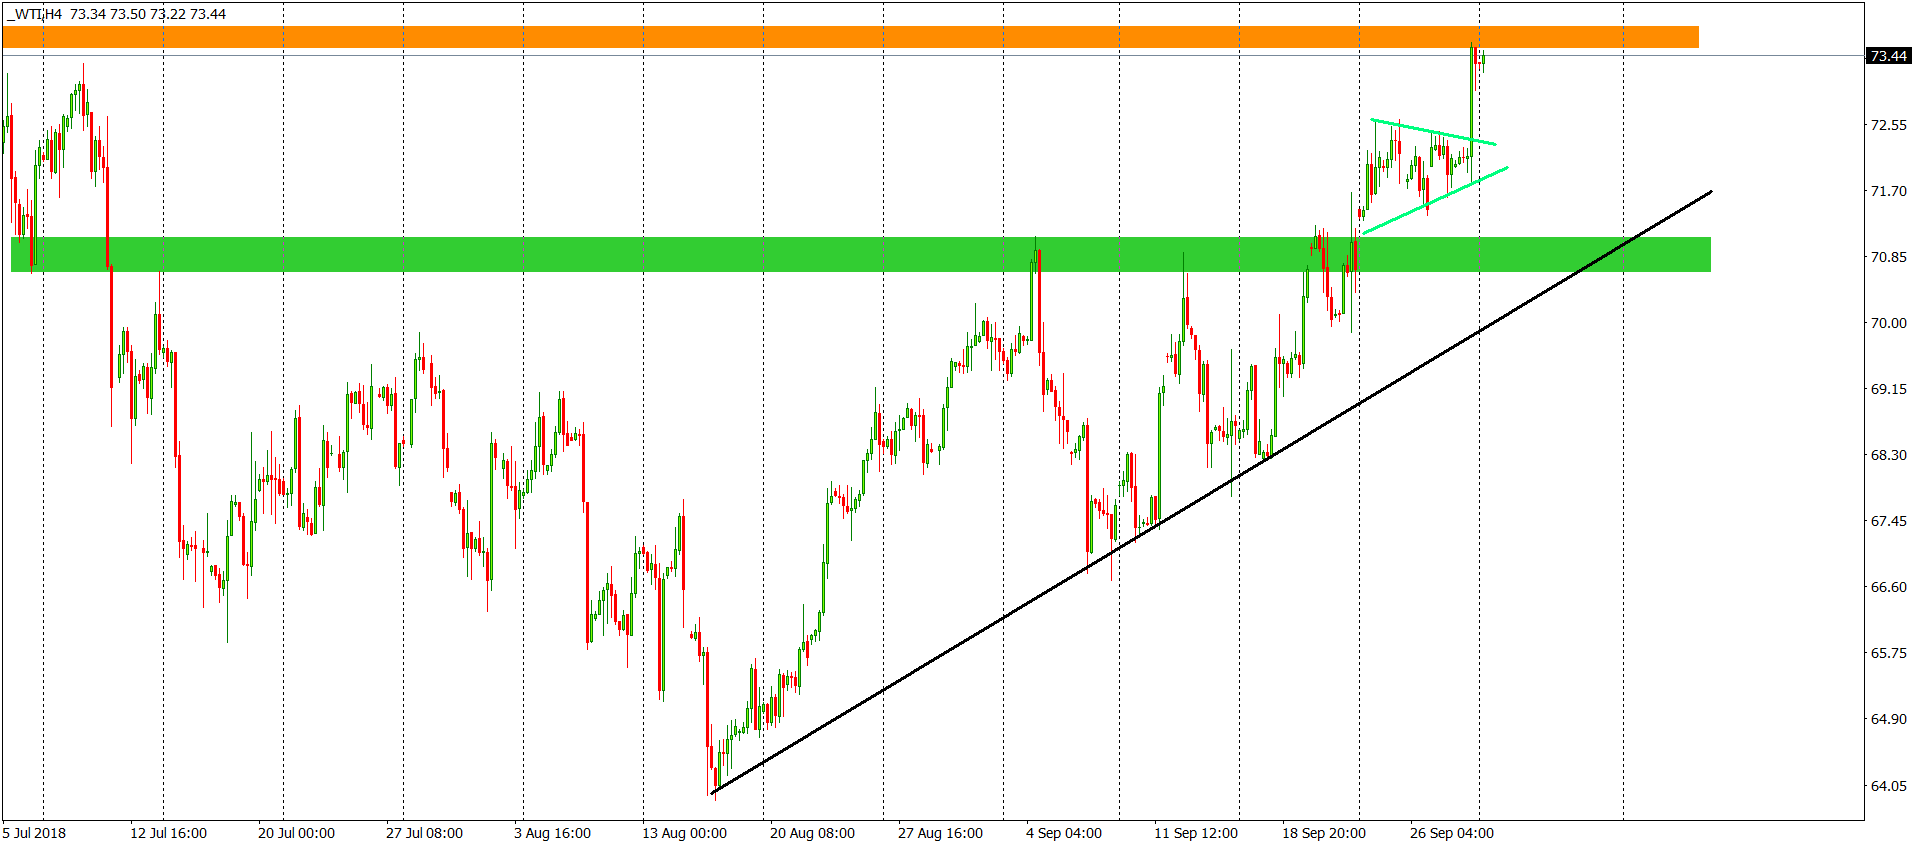
WTI went up! We broke the neckline of the iH&S formation and the upper line of the triangle. After that, WTI created a pennant pattern (green lines), which was promising for the buyers. Last week, ended with the bullish breakout, which confirmed the buy signal and gave us a positive momentum. This momentum, allowed the price to test the horizontal resistance created by the highs from the beginning of July. That can be a good place for a bearish correction but the main, long-term sentiment remains positive.


Comments (0 comment(s))