WTI Oil Analysis – Resistance => Support

Second technical analysis is about the WTI Oil. Instrument, which was previously analysed on the 1st of October. Our view on the black gold was bullish and we were positive, especially in the long-term. Time to verify if our view on this instrument was good or not but first, let’s see what we wrote in our previous piece:
“This momentum, allowed the price to test the horizontal resistance created by the highs from the beginning of July. That can be a good place for a bearish correction but the main, long-term sentiment remains positive. „
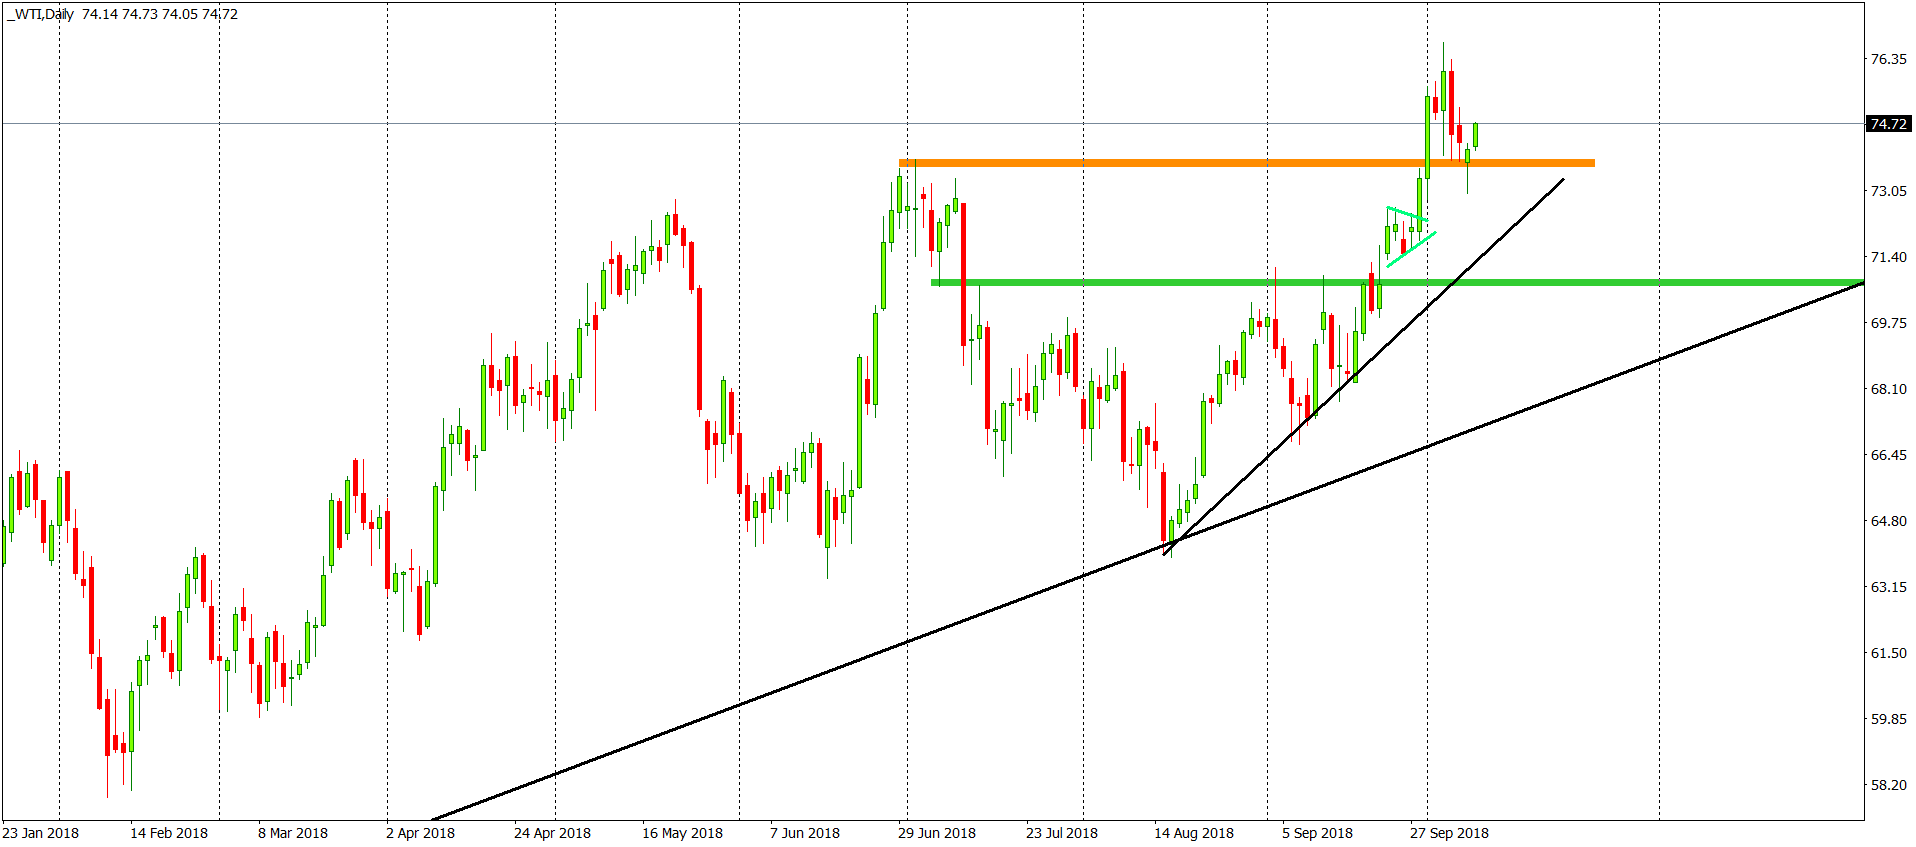
This small correction happen and as expected, after this, the price went higher. That resistance mentioned above was and is absolutely crucial for the mid-term situation on this instrument. Yesterday, price tested it as a closest support. Test resulted with a bullish hammer candle on the daily chart, which can be perceived as a strong buy signal. Even alone, without any additional factors. Today, traders are following that and we can see a nice bullish candle too. The buy signal is on, as long as we stay above the orange support.


Comments (0 comment(s))