WTI Oil Analysis – Trump sends the black gold further south

The second piece in today’s technical part is the WTI Oil. Our last piece about this instrument was written on the first day of November, when the price was on the 65 USD. We were still in a deep downtrend and we saw no chances for any bigger upswing. Our outlook was negative:
“The sell signal is on, which should bring smile to our faces, especially on the petrol stations. „
Look at the chart now! That was a great call. Since that, the Oil had only bearish days and the price declined almost 6 USD! WTI managed to break the horizontal support slightly above the 64 USD/bbl (purple). We also managed to keep the down trendline alive (red), despite the fact that this line is very steep (so easy to be broken). Currently, the Oil is on the orange horizontal support, which is a 50% retracement line. That can be a good place for a pause and an initiation of the bullish correction. Yes, could be, only if not the comments from Donald Trump who said this:
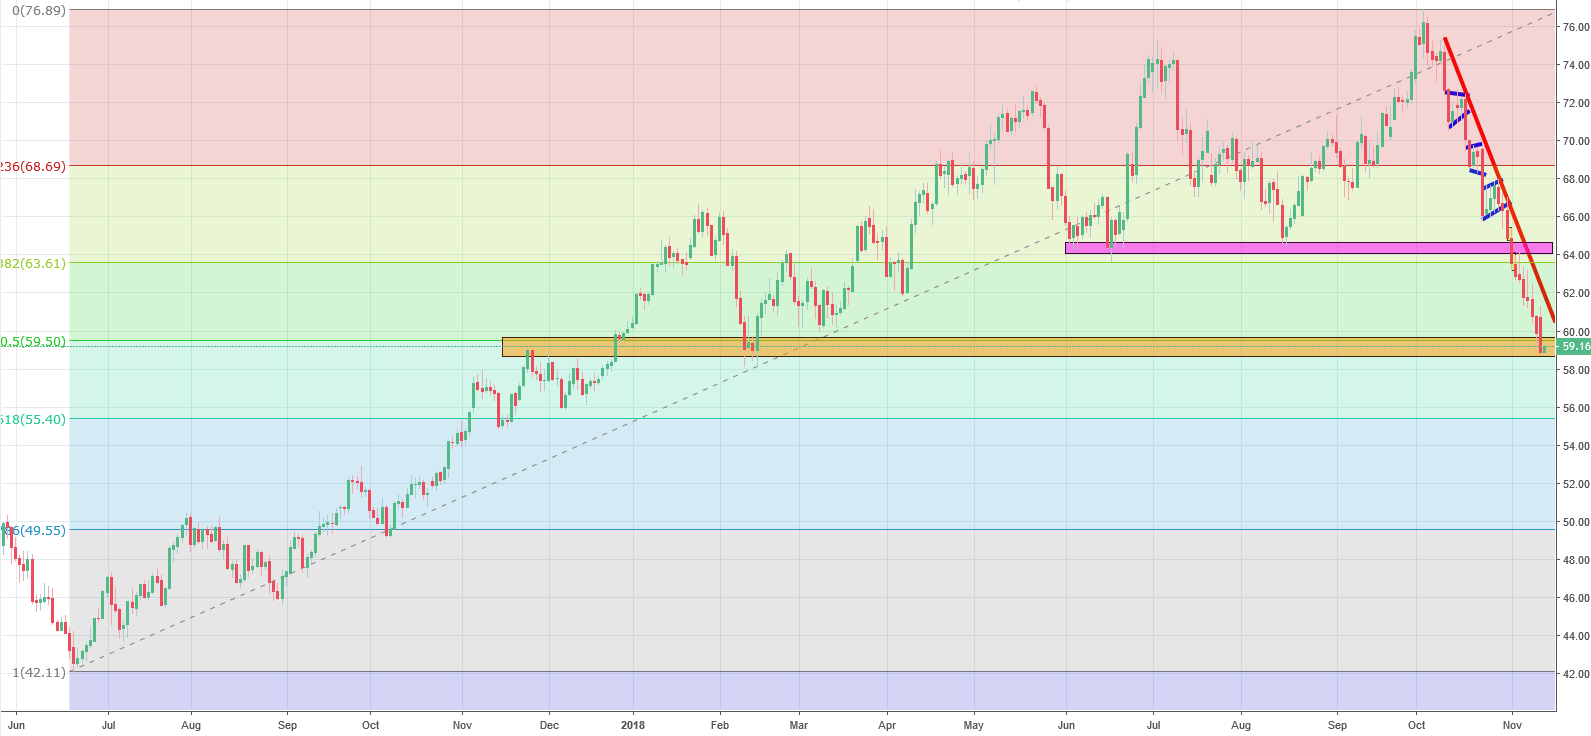
„Hopefully, Saudi Arabia and OPEC will not be cutting oil production. Oil prices should be much lower based on supply! „
After that tweet, the price went significantly down. Apart from the fact that we do have support, there are no other positive factors here. Stronger USD is also not helping. The long-term sell signal remains intact.


Comments (0 comment(s))