WTI Oil Analysis – Unlucky October…

Everybody is talking about how bad the October was for the world’s indices but there is one instrument that suffered similar wounds – Oil. October started on long-term highs and ended on the lowest levels since the mid of August. Was that expected? Well, on this portal yes. This is what we wrote about the potential target on the 18th of October, when the price was slightly below the 70 USD/bbl:
“Well, the long-term up trendline, that was mentioned by us in our previous analysis is around the 68 USD/bbl, so that is the price, which is on our mind. The mid-term sentiment on Oil remains bearish. „
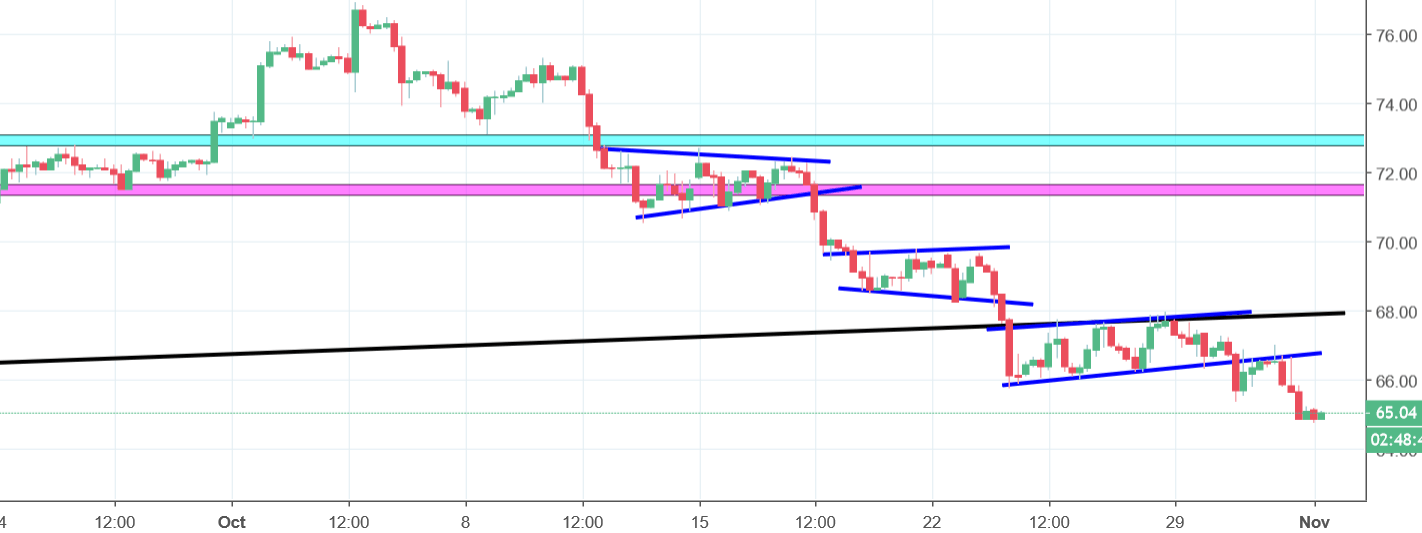
That line was reached on the 23rd of October. Nice! WTI broke the long-term up trendline (black), which sorts out the sentiment for the next few months. Most recently, the price created a third trend continuation pattern in a row (blue flag), which ended with a breakout of its lower line. In addition to that, we already tested that line as a closest resistance, which resulted with a bounce. The sell signal is on, which should bring smile to our faces, especially on the petrol stations.


Comments (0 comment(s))