0x Analysis – Nice bearish setup

Today, one of the biggest losers on the top of the list is 0x. Previously, we wrote about this instrument at the end of June, when the price was making new mid-term lows. Back in that day, we were bearish saying this:
„We just broke the lower line of the pennant (yellow lines), which triggers us a sell signal. Short positions will be denied, when the price will come back above the 0.7 USD, which for now is less likely to happen. Why 0.7 USD? Cause getting there will deny the pennant, simple is that. „
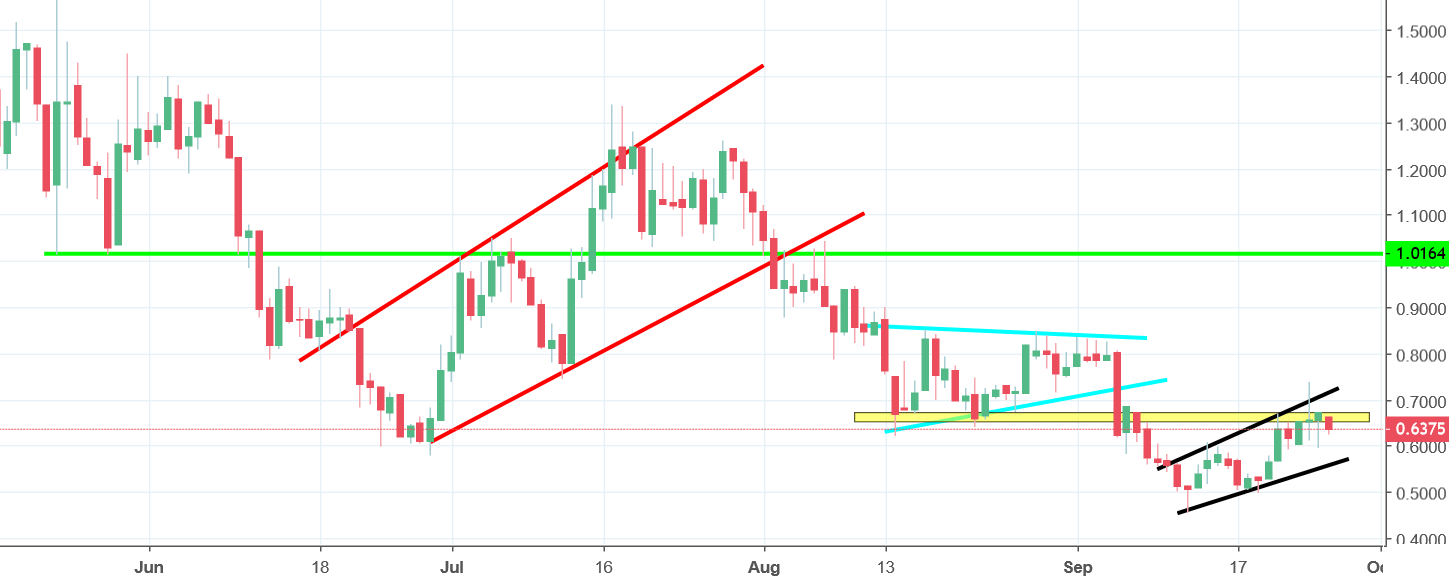
What happened after that? Sell signal got denied one day later. Well, sometimes you win and sometimes you learn. That was a good stop loss though. In the next few days the price went vastly higher. Well…if you bought this crypto you cannot complain for sure. The upswing that happened afterwards did not change the main trend though. The price remained in a bearish trend and created three continuation patterns: flag (red), triangle (blue) and flag (black). First two resulted with the drop. The last one is still active but according to the technical analysis, we are expecting a breakout to the downside.
Sentiment remains negative, especially, that we just bounced from the horizontal resistance marked with a yellow colour. As long as we stay below, the sell signal is on.


Comments (0 comment(s))