Aeternity Analysis – Broken down trendline

Friday starts with the analysis of the Aeternity, which was previously mentioned on the 27th July, when the price was on the 1.91 USD. Back in that day we were bearish, seeing two negative formations at once:
„Since that, the price entered the sideways trend locked inside of the descending triangle pattern (green). This formation promotes a further drop, especially that recent bounce from the upper line ended with a head and shoulders pattern (yellow rectangle). „
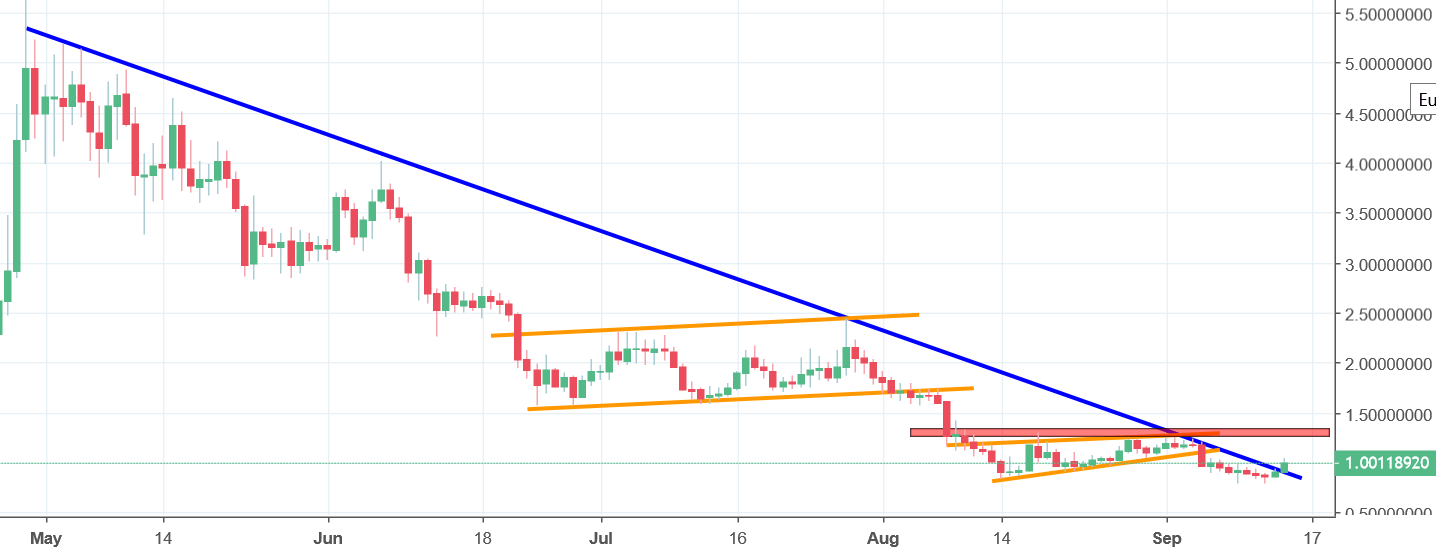
Since those words were written, the price was mostly going down, reaching area around 0.8 USD at the beginning of September. Great call, huh? The drop was very technical, AE made two correction patterns (orange) and respected the blue down trendline. Friday, brings us a 10% upswing and the breakout of the major down trendline. That can be optimistic and can initiate us a mid-term bullish correction. As long as the price stays above the lows from today, the sentiment is positive.


Comments (0 comment(s))