Aion Analysis – Another Head and Shoulders pattern
Tuesday starts with the analysis of the Aion. Previously this altcoin was mentioned by us on the 14th of May, when the price was creating a bullish reversal pattern – inverse head and shoulders formation. The price broke the neckline but we were pretty suspicious about the buy signal and we advised our readers to be cautious:
„Unfortunately for the buyers, it was not so smooth. Yes, today, the price broke the neckline but as for now, this is a false breakout (pink). If the price will not be able to close a day above that level, the strong sell signal will be triggered. The price closing a day below the neckline will be a clear sign to sell, with the potential target on the 2,55, so the lows from the 11th of May.”
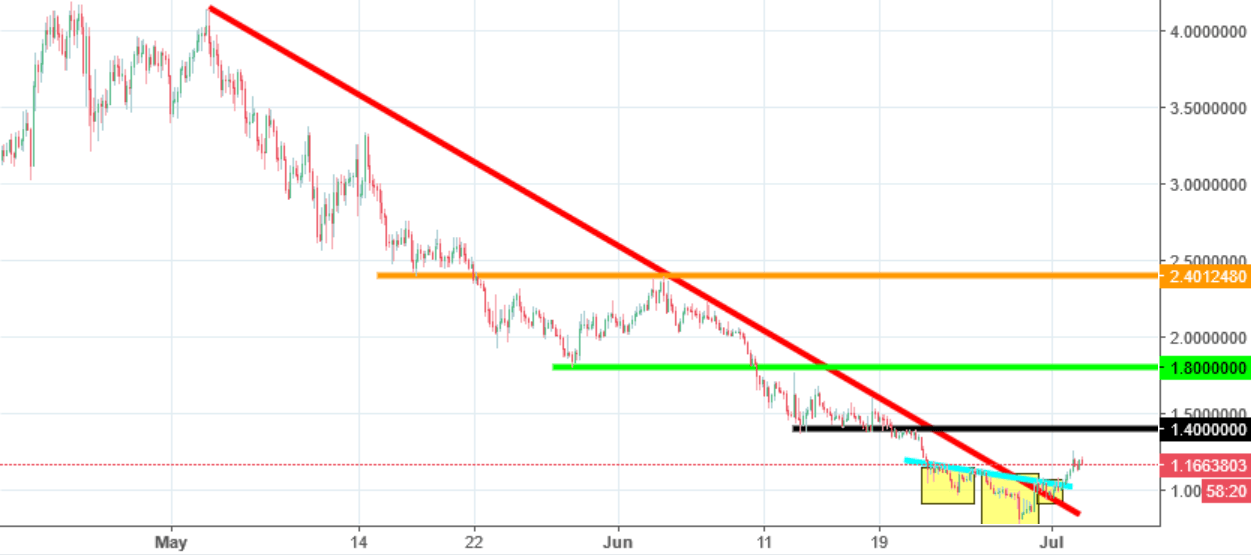
Aion did not manage to climb higher, which was a trigger to go short. As expected, obviously. And that was a pretty good sell signal as the price fell from 3.1 USD to almost 0.7 USD.
Are we still bearish here?
Not so much to be honest with You. As for today, we can see an interesting positive setup on the H4 chart of the Aion. First of all, we can see another inverse head and shoulder pattern (yellow rectangles), where we also broke the neckline (blue). This time, breakout seems legitimate and sustainable. What is more, the price broke the mid-term down trendline (red). The current target for this movement is the horizontal resistance on the 1.4 USD (black) and in my opinion we should get there fairly easy.


Comments (0 comment(s))