Aion Analysis – iH&S worked…almost
Maybe Litecoin from our previous analysis is doing good but it does not mean that all cryptos are on the green side of the screen. In this analysis, I will talk about Aion, which is showing few negative signs and currently, the bearish movements seems more probable here.
To be honest with You, till today, everything was looking very good! The price was creating a bullish reversal pattern – Inverse Head and Shoulders formation (yellow rectangles). That pattern was looking extremely good as, at first, it helped to break the mid-term down trendline (red) and second, after the breakout, we tested that line as a support. Nice and clean price action setup to buy!
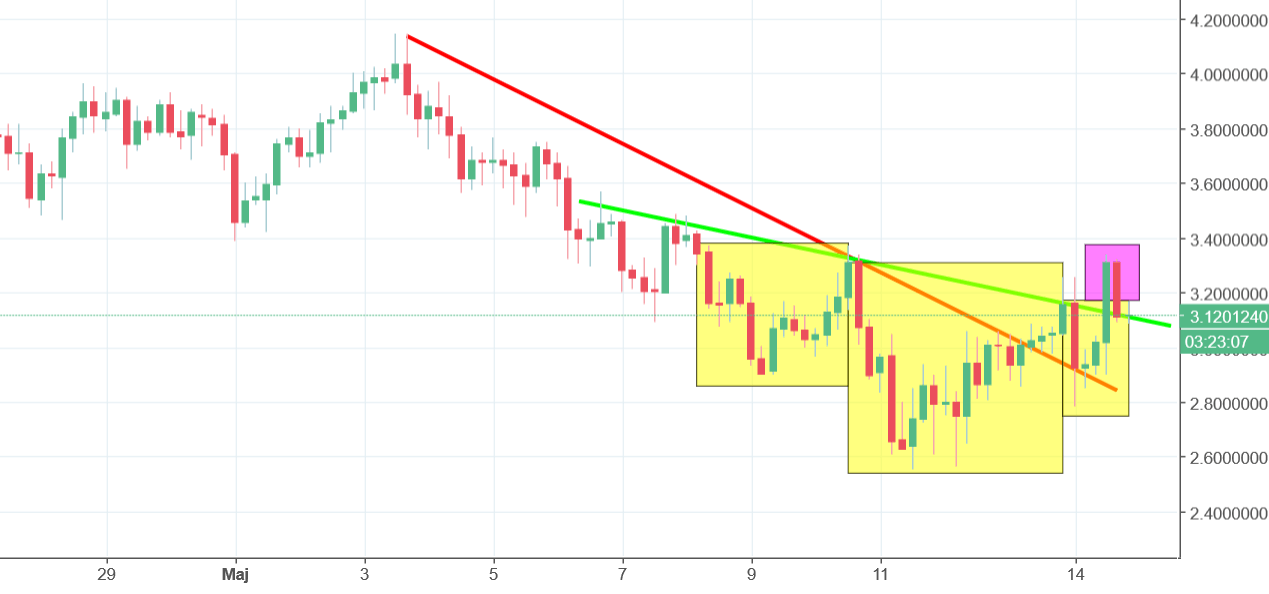
Unfortunately for the buyers, it was not so smooth. Yes, today, the price broke the neckline but as for now, this is a false breakout (pink). If the price will not be able to close a day above that level, the strong sell signal will be triggered. The price closing a day below the neckline will be a clear sign to sell, with the potential target on the 2,55, so the lows from the 11th of May.


Comments (0 comment(s))