Aion Analysis – from the iH&S to the H&S
Thursday starts with the analysis of Aion, previously mentioned by us on the 3rd of July. Surprisingly, we were not totally bearish on this coin like on the others. Back in that day, Aion had a very interesting bullish setup:
“As for today, we can see an interesting positive setup on the H4 chart of the Aion. First of all, we can see another inverse head and shoulder pattern (yellow rectangles), where we also broke the neckline (blue). This time, breakout seems legitimate and sustainable. What is more, the price broke the mid-term down trendline (red). The current target for this movement is the horizontal resistance on the 1.4 USD (black) and in my opinion we should get there fairly easy. „
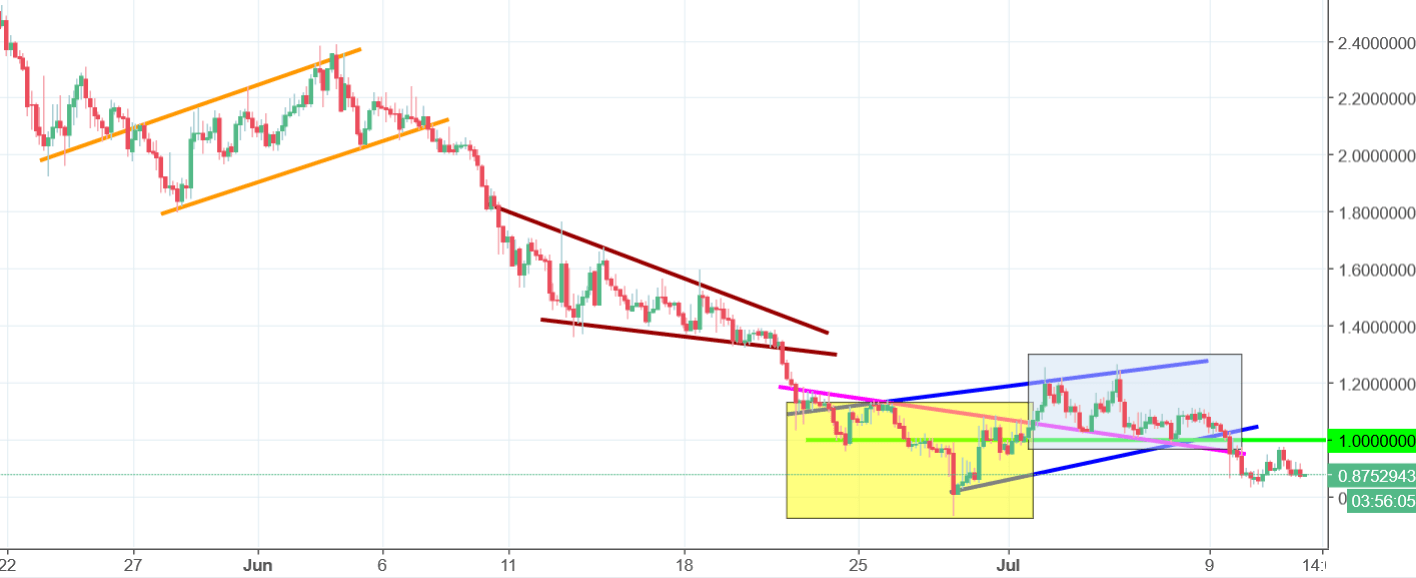
The price failed to fulfil our scenario. Instead of using the inverse head and shoulders pattern (yellow), sellers managed to draw a normal version of it (grey), which on the 9th of July resulted with the breakout of the neckline and a legitimate sell signal. In the meantime, the price respected the psychological level – 1 USD. Currently, this line (green) is a resistance and as long as we stay below, the sentiment is negative.


Comments (0 comment(s))