Ardor Analysis – Broken supports, crashed dreams

The last day of the week, starts with the analysis of the Ardor, which was previously mentioned on our portal on the 30th of July. Although we were above two important supports, we were not optimistic and we were expecting a further drop:
“In the mid-term, we still have two supports left. First one is the horizontal support on the green area and the dynamic support (blue), which is connecting recent higher lows. Once this one will be broken, we will get a proper sell signal with the potential target on the lows from the end of June. „
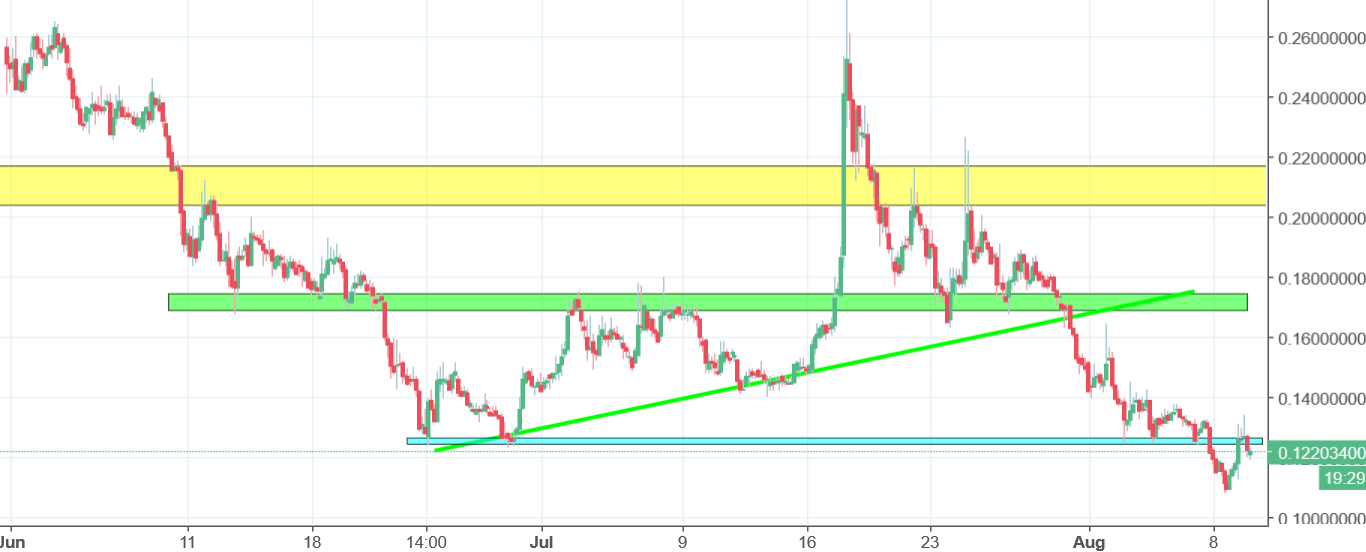
Those supports were broken one day after those words were written! The price declined from the 0.17 to 0.10 USD. We said that the target was on the lows from June and we reached those fairly easy. What is interesting, is that the ARDR broke that area and yesterday, used that as a closest resistance (blue). Friday starts below the blue line, which is definitely a bearish factor. In this case, yesterday’s upswing can be considered only as a small one-time reversal. Sell signal is still on.


Comments (0 comment(s))