Bancor (BNT) Analysis – Bounce from the down trendline

The next one today will be about the Bancor. Long time, no see as the previous analysis was written on the 18th of May. Yes, maybe it was long time ago but the signal was definitely spot on. I guess that you got used to that by now. OK, let me show You, what we wrote previously:
“For a proper sell signal, we need to see the price breaking the neckline of the H&S formation, which in the same time is the horizontal support on the 4,2 USD (green). As long as we stay above, we do not have a sell signal. Only the breakout to the downside will be significant to open a short position and the patient traders should wait for that.”
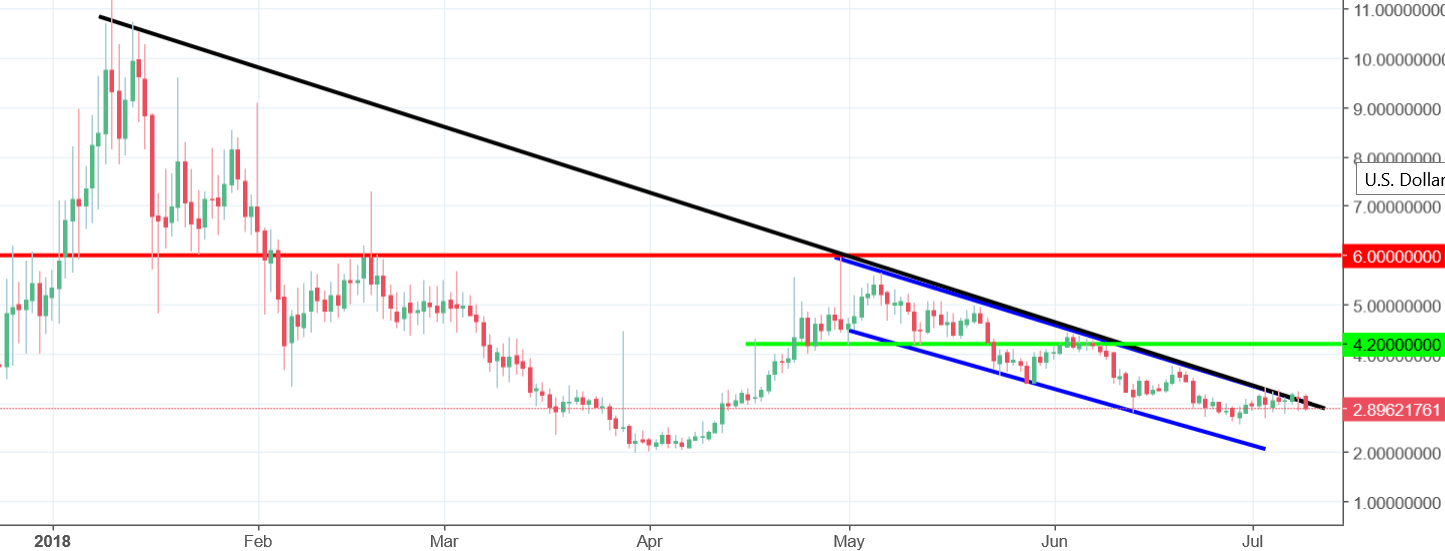
4,2 USD was broken few days later, on the 22nd of May. After that the price declined but also tested the broken support as a resistance. The test was positive for sellers and the BNT went significantly lower reaching the local lows around 2.60 USD at the end of June. From 4,2 to 2,6 USD in slightly more than a month. If that is not a good sell signal then I do not know what is.
Currently, the price is trying to break the main down trendline and the upper line of the channel down formation. As for now, unsuccessfully, which opens us the way towards new lows. Our outlook on this coin is negative.


Comments (0 comment(s))