BinanceCoin Analysis – Bounce from the local resistance

First analysis of the day is the BinanceCoin, which was previously mentioned on the 6th of June, when the crypto was making new mid-term highs and the price of the BNB was 16,2 USD. Back in that day, we said this:
“As long as we stay above the blue line we do have a positive sentiment here. Binance Coin is in a good shape and in the next few days, should continue to climb higher. „
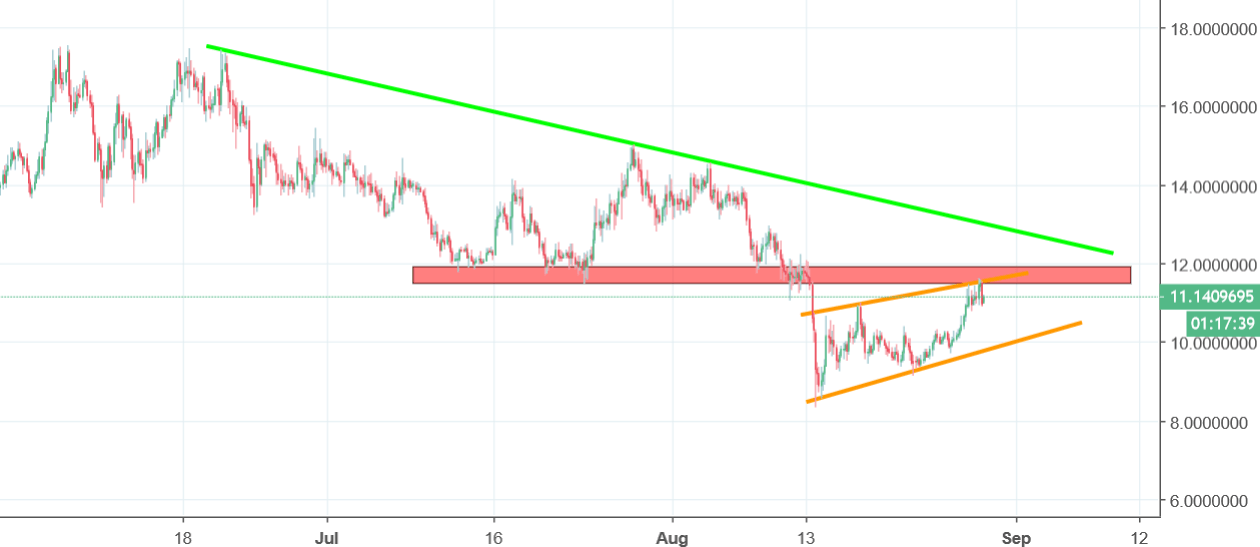
The price did climb slightly higher and topped on the 17.4 USD. That area, in the next few days, was tested three times and every time brought us a bearish bounce. That was it. The blue line, which was mentioned in the first analysis was eventually broken and that gave us a strong sell signal. In the middle of August, the price set local lows close to the 8 USD. Since that, we do have a bullish reversal but in my opinion, this is just a mid-term correction. The price is locked inside of the flag pattern (orange lines) and we just freshly bounced from the horizontal resistance on the 11.6 USD. As long, as we stay below this line, the sentiment is negative.


Comments (0 comment(s))