Bitcoin Analysis – broken up trendlines

After yesterday’s session, now, all eyes are on the Bitcoin again. The main crypto declined sharply and went to the lowest levels since the April. Was that a surprise? Not so much. We expected that in our previous analysis. Actually, we expected both: a short-term upswing and a further, bigger drop. That is precisely what happened and I hope that our traders took advantage of our last analysis (28th of May):
“Our long-term target on the 6000 USD does not change but in the meantime we reached an important dynamic support, which may stop the further decline. This support is the lower line of the symmetric triangle pattern (lower red) and may give a short-term boost for the buyers. May but does not have to and as usual, we need to wait for the price action to tell us, in which direction traders want to go. “
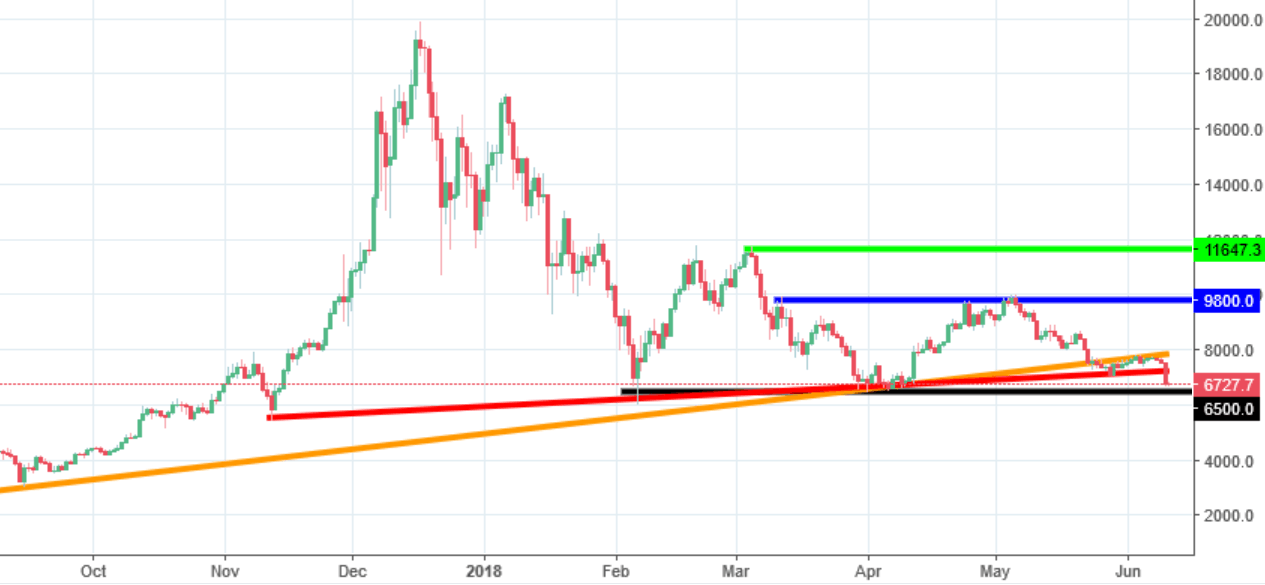
Lower line of the triangle really brought a mid-term help. The price bounced and in the next few days went higher but yesterday, that support was finally broken. Now, the price is aiming the horizontal line on the 6500 USD and the chances that we will get there are quite high. Actually, we should go much lower as both important, dynamic supports got already broken. The only one left is this horizontal one but should not give any bigger headache for the sellers.
Negative sentiment will be denied when the price will come back above both up trend lines but chances for that are now limited.


Comments (0 comment(s))