Bitcoin Analysis – BTC on the lower line of the triangle

Second piece of the day will be about the main crypto on the market: all mighty Bitcoin. Previously, we talked about this crypto on the 18th of May and we were bearish. The price was around the 8100 USD and back in that day, we said:
“As for the current target we have to come back to the downside. Few weeks ago, the movement towards the 11k USD (green) was more probable but with the recent price swings, we expect the BTC to aim the support on the 6000 USD (black) again. „
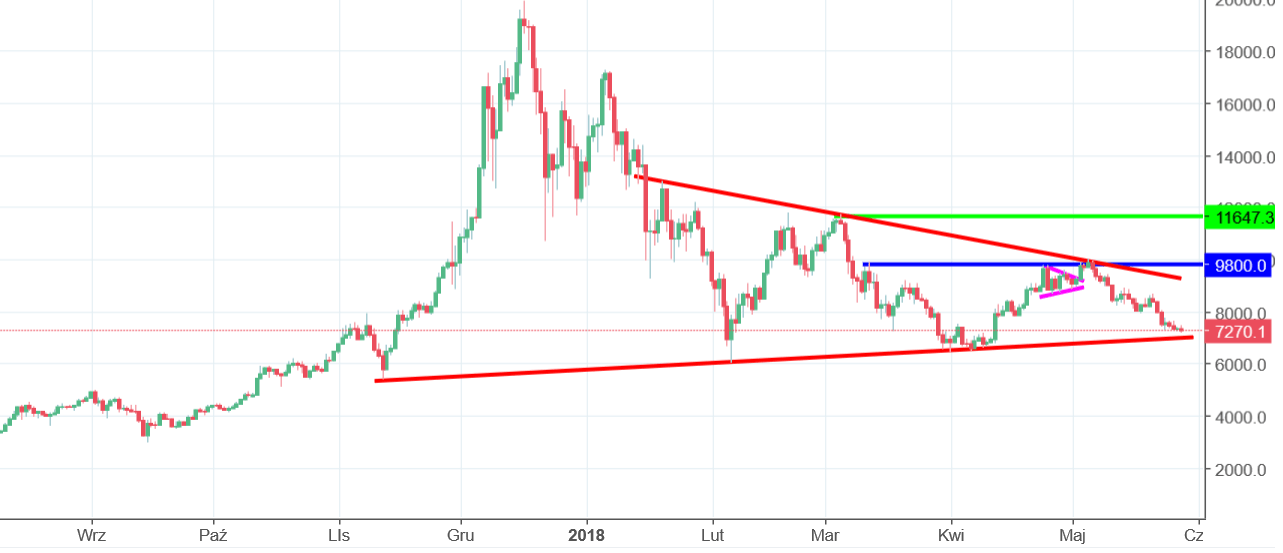
Probably you got used to that but this is another time, when our prediction was spot on. Since that words were written, the price was mostly going lower, drawing red daily candles. Our long-term target on the 6000 USD does not change but in the meantime we reached an important dynamic support, which may stop the further decline. This support is the lower line of the symmetric triangle pattern (lower red) and may give a short-term boost for the buyers. May but does not have to and as usual, we need to wait for the price action to tell us, in which direction traders want to go.
Bullish bounce from that line will be a buy signal and a constant bearish pressure on that level will be a sign of imminent breakout and an invitation to go further south.


Comments (0 comment(s))