Bitcoin Analysis – all eyes on the 5500 USD

First analysis on Friday will be written about the Bitcoin. We do not have good news here but most probably, if you are a BTC hodler, you already now that, as you are probably nervously checking the price every other minute. Since the beginning of May, after reaching the resistance on the 9800 USD (blue), the price is constantly going down. The last time, we wrote about the BTC, when the price was above the lower line of the triangle. It was on the 28th of May and back in that day, we wrote this:
„Bullish bounce from that line will be a buy signal and a constant bearish pressure on that level will be a sign of imminent breakout and an invitation to go further south. „
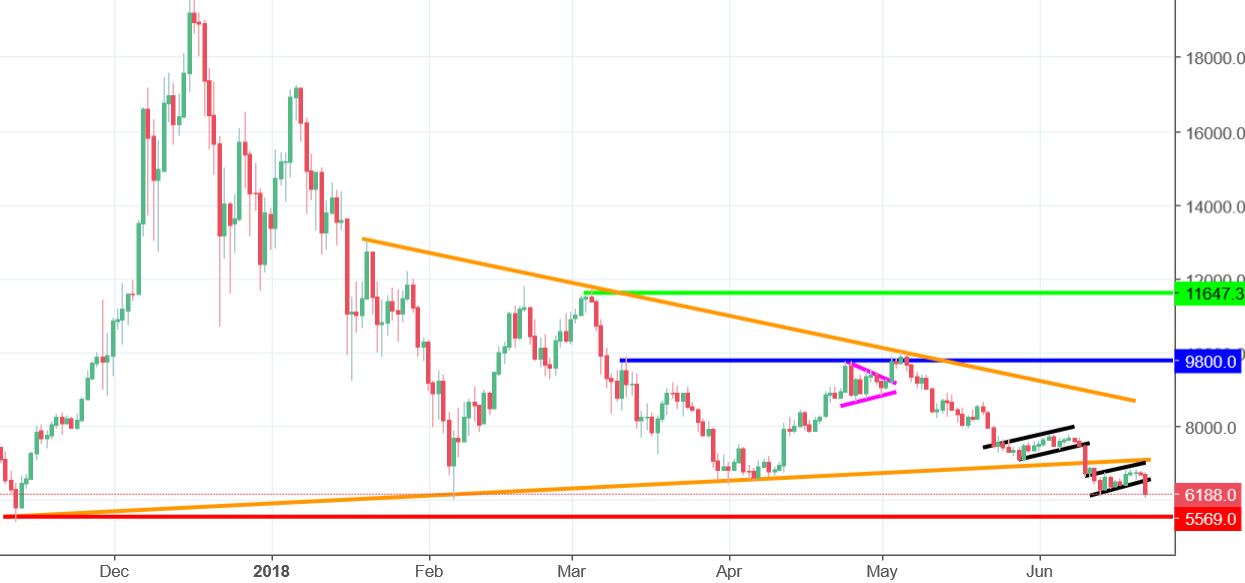
We had pressure, which led to the breakout and a further drop. After the breakout, the price created a trend continuation pattern (flag), which finished with the breakout of it’s lower line. Actually, breakout is happening now so the sell signal is fresh as your morning croissant. The current target for this decline is the ultimate horizontal support on the 5500 USD (red). Chances that we will get there are quite high, actually, with the current situation, it looks imminent. Sell signal will be cancelled when the price will come back above the lower line of the triangle.


Comments (0 comment(s))