Bitcoin Analysis – Head and Shoulders pattern is still helping

The last coin of the day will be the main cause of all that hype on the market, so Bitcoin. The biggest cryptocurrency in the world created this base inverse head and shoulders pattern, which brought us an optimism to the whole crypto market. Let’s analyse this situation in a bit greater detail. Previously, we mentioned the BTC on the 22nd of June, when the price was on the 6188 USD:
“The current target for this decline is the ultimate horizontal support on the 5500 USD (red). Chances that we will get there are quite high, actually, with the current situation, it looks imminent. Sell signal will be cancelled when the price will come back above the lower line of the triangle. „
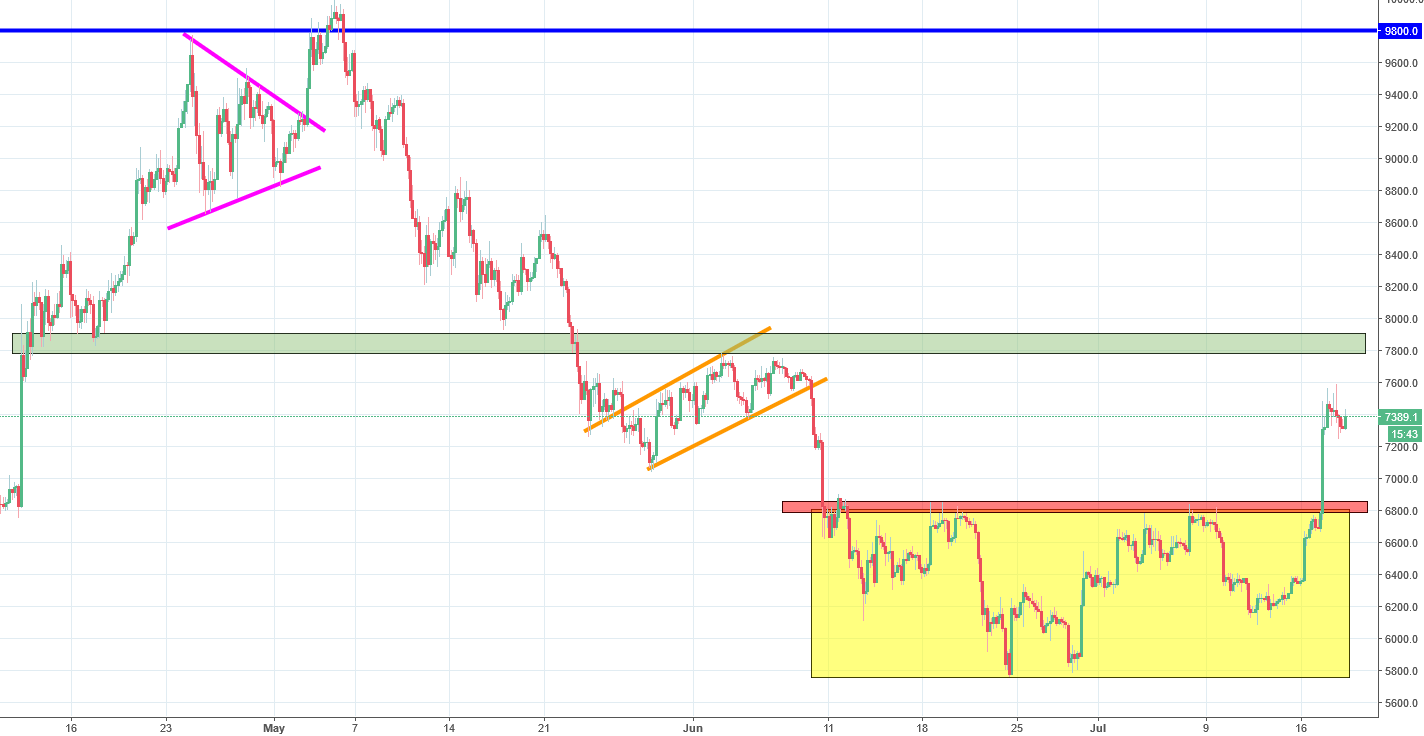
Bearish view was good but just for a few days. The price did not manage to reach the 5500 USD but stopped on the 5750 USD, almost there… Anyway, that was the place, where traders started to buy the BTC. The price created an inverse head and shoulders pattern (yellow) and went higher. The breakout of the neckline that we had 2 days ago, accelerated the movement. Currently, we do have a small bearish correction but the buy signal is still on and we should be still aiming higher. First potential target is on the 7900 USD (green)


Comments (0 comment(s))