Bitcoin Analysis – Pennant works, 9800 USD too

Last but not least, Bitcoin again. On the BTC, we do have a legitimate mid-term buy signal. It was not so clear at the end of the April, when the price was creating a false breakout pattern on the daily chart. On the 26h of April, when we analysed the BTC for the last time, we wrote:
“False breakout is still there. Actually it gives us a great mid-term selling opportunity with a desirable risk to reward ratio: tight, low stop loss and potentially a nice, big profit (6000 USD ?). Only the price closing above the highs from Wednesday will deny this bearish option and will trigger a strong buy signal. „
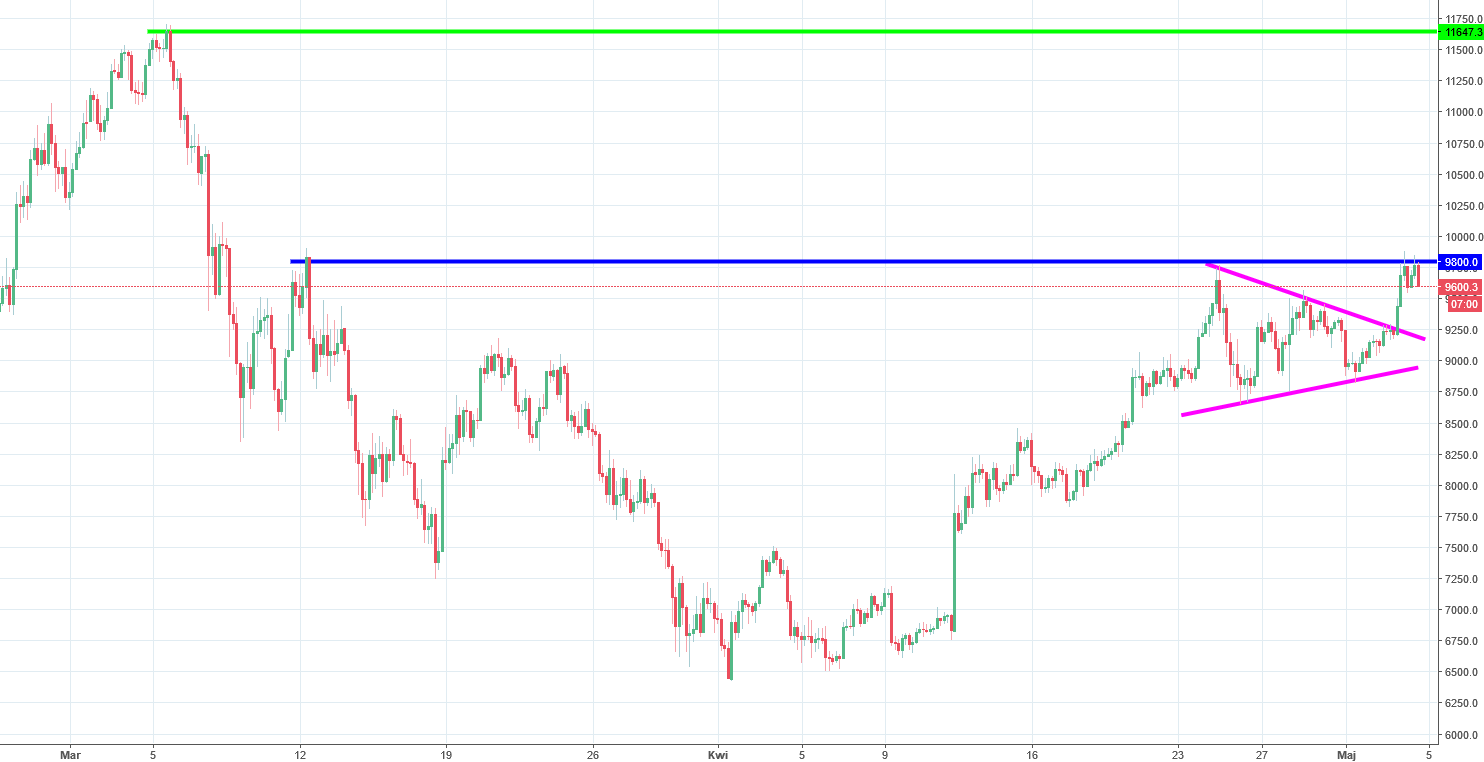
The current price movements gave us the second option: the denial of the sell signal. After our analysis, the price moved sideways and created a pennant formation (pink lines). Yesterday, buyers managed to break the upper line of the pennant, which triggered us a buy signal. It was generally expected as pennant is a trend continuation pattern and that was the trend since the beginning of the April.
The upswing was looking strong at the very beginning but the price stopped on the 9800 USD resistance (blue). The bounce from the blue level gives us a short-term sell signal. The mid and the long-term signal stay the same and its a buy with the target on the 11600 USD (green).


Comments (0 comment(s))