Bitcoin (BTC) Analysis – False Breakout is still in the game

Yes, I know that you are all concerned mostly about the Bitcoin. So here it is, the analysis of the almighty father of all altcoins: BTC. The last time we wrote about the Bitcoin on Tuesday, when the price was around the 9300 USD. We were obviously optimistic as the price broke an important resistance on the 9080 USD. The upswing was strong but not strong enough. The momentum was sufficient only to reach the 9700 USD. After that, the next day, the price reversed.
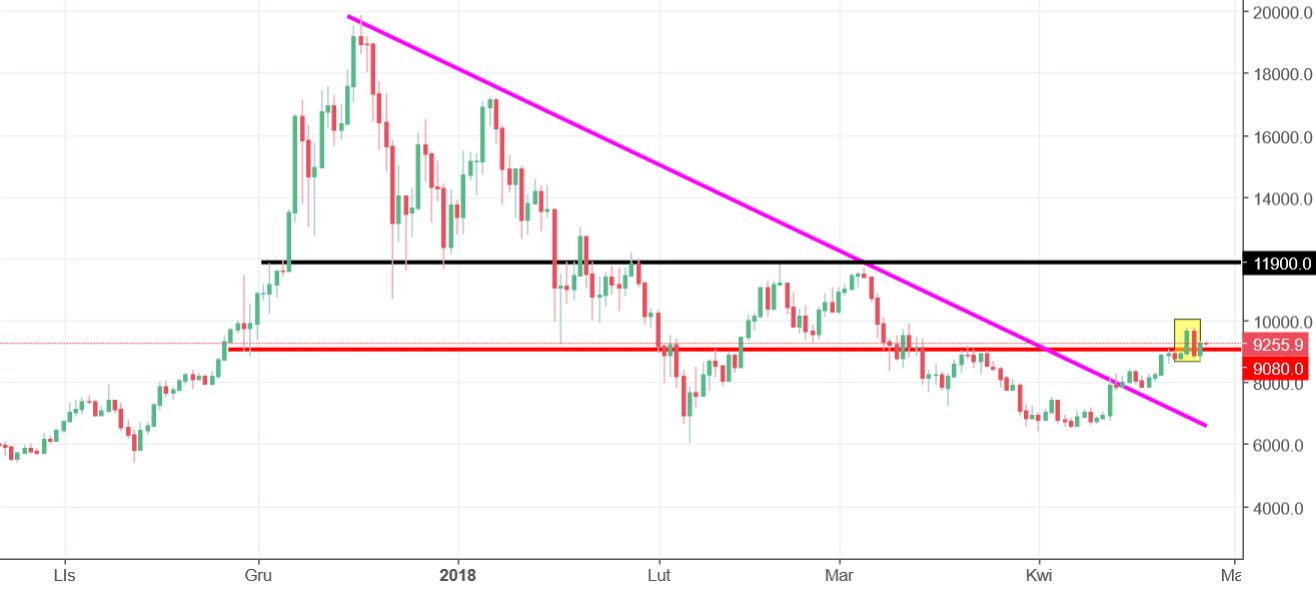
That reversal would not be a big problem if not the fact that it is a typical false breakout pattern (yellow rectangle). False breakout is a well known price action pattern and it is very efficient in signalling a reversal, opposite to the breakout. They work, they are reliable but they are also wrong. Seldom but still. The fact that the BTC is not going lower now can be a signal that the pattern is not working here, at this particular moment. Even if the false breakout is weak, it does not mean that there is a buy signal now. As long as the price stays below the highs from Tuesday and Wednesday, we cannot fully support the buying option.
How to trade this?
False breakout is still there. Actually it gives us a great mid-term selling opportunity with a desirable risk to reward ratio: tight, low stop loss and potentially a nice, big profit (6000 USD ?). Only the price closing above the highs from Wednesday will deny this bearish option and will trigger a strong buy signal.


Comments (0 comment(s))