Bitcoin Cash Analysis – Bounce from the 1300 USD keeps the bearish dream alive

Next one will be the Bitcoin Cash and here we will show You how important is the game of supports and resistances. Previously we talked about this altcoin on the 7th of May and we pointed that the sentiment is totally dependent from one horizontal level – 1600 USD:
“Currently we are in a perfect place for the price action traders as broken resistance is being tested as a closest support. As long as we stay above the red area, everything seems under the bullish control. The price breaking the red area and aiming lower will be signal to open a short position. „
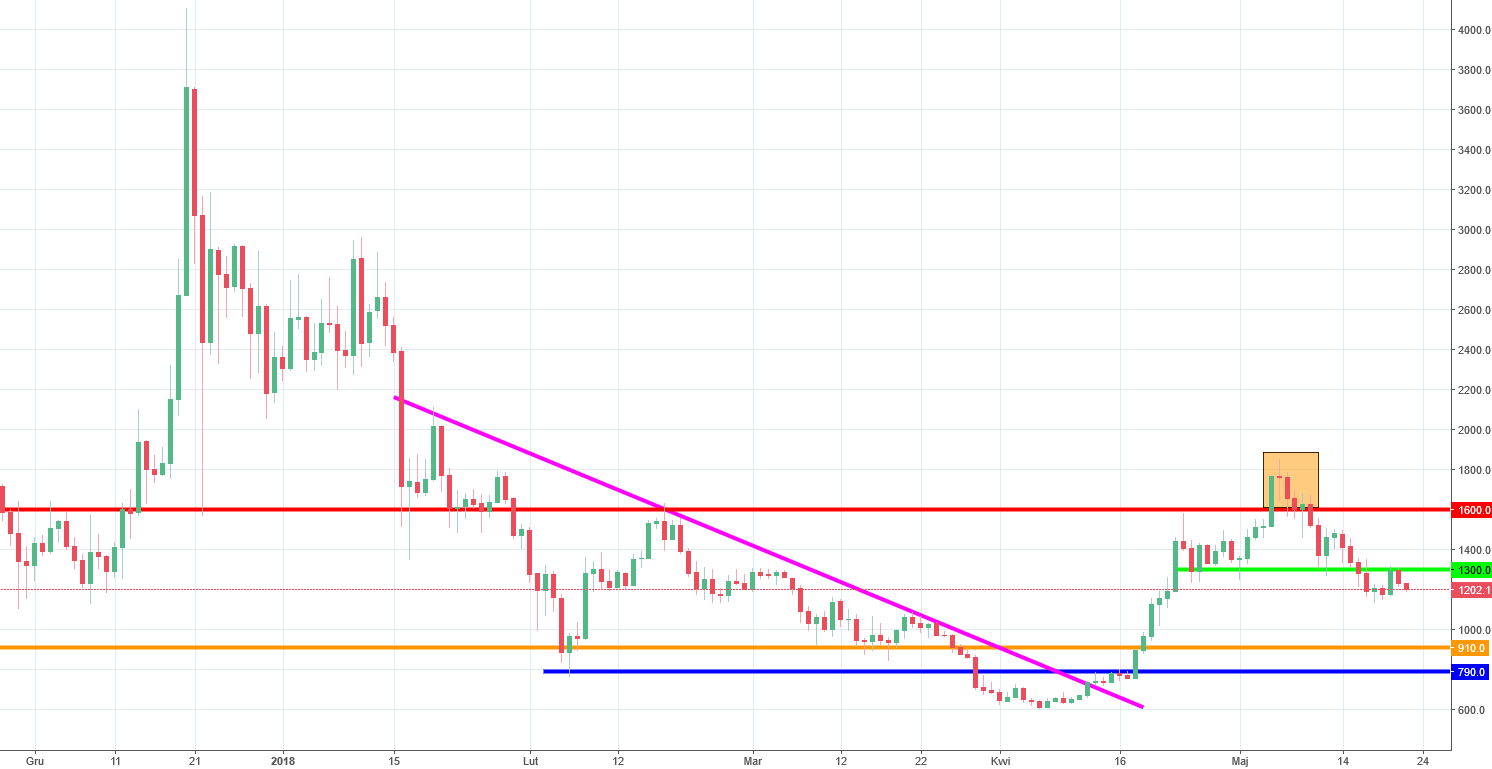
Although the bounce was more probable, it did not happen. After few days, the price broke that support and the buy signal was not triggered. We got a sell one instead. The sell signal is supported by the lase breakout pattern (orange rectangle, above the 1600 USD) and the fact that the price broke the mid-term support on the 1300 USD (green) and then successfully used that as a resistance. We can see that horizontal levels on the Bitcoin Cash are very important and traders tend to respect them with high accuracy.
As long as we stay below the green line, the sell signal is on. The potential targets for this movement are the 910 and 790 USD.


Comments (0 comment(s))