Bitcoin Cash (BCH) Analysis – Broken resistance tested as a support

Today’s analysis we start with the Bitcoin Cash and our great forecast that we made on the 24th of April, when BHC was aiming the long-term resistance on the 1600 USD. Back in that day, we said:
„Now we reached the resistance on the 1600 USD (red). On the paper it looks promising and may be the reason to take some profits from the recent surge. Do not take that for granted though. The price can break that level with ease so you always have to wait for the proper price action. Sentiment is obviously positive. „
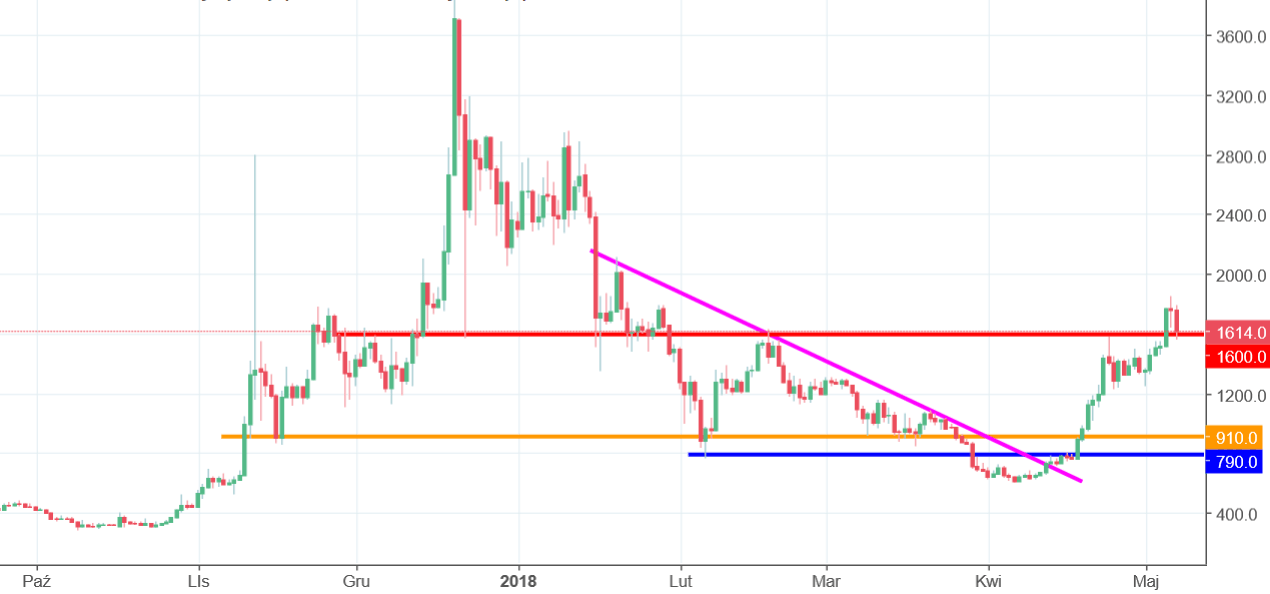
The price reached that level and indeed it was a trigger to take some profits from that upswing. BCH bounced from that level and went almost 400 USD lower. Then we moved to the second part of our analysis. Price broke that resistance with ease and went higher. Currently we are in a perfect place for the price action traders as broken resistance is being tested as a closest support. As long as we stay above the red area, everything seems under the bullish control. The price breaking the red area and aiming lower will be signal to open a short position. First option, curently seems more probable.


Comments (0 comment(s))