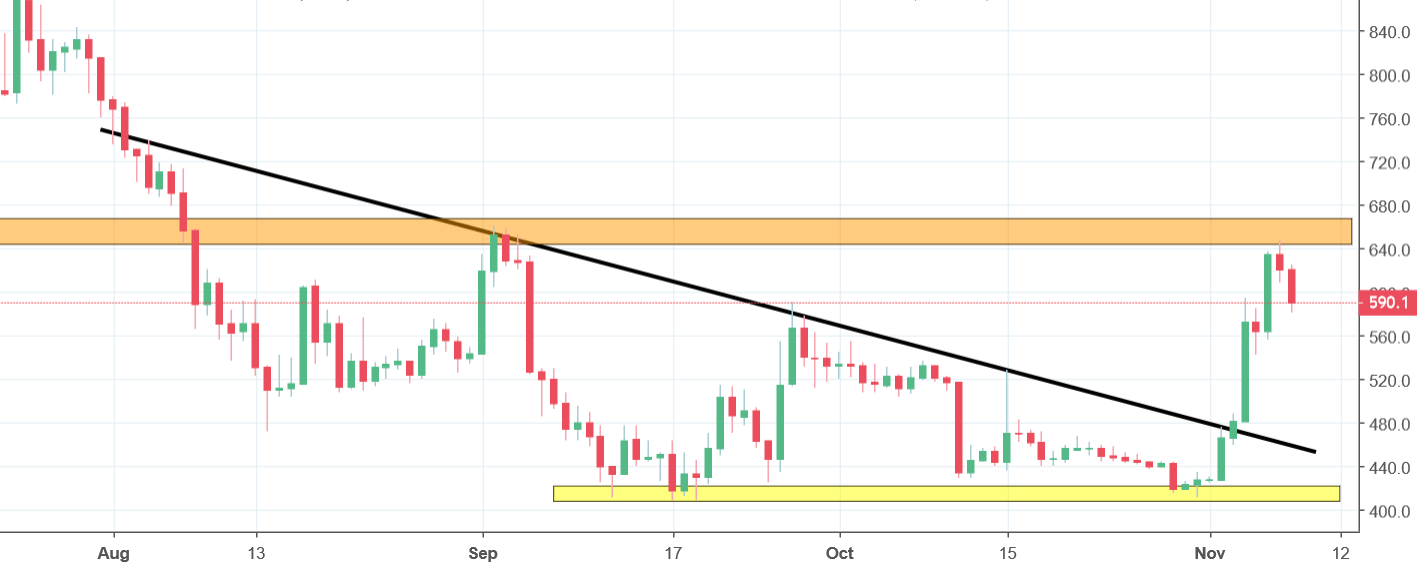
Bitcoin Cash Analysis – Denied descending triangle pattern

Thursday brings us a small reversal in the crypto world. Prices of most of the instruments are going down and one of the major losers among the top cryptos is the Bitcoin Cash. BCH was previously mentioned here on the 14th of August, when the price was suffering heave loses after the bounce from the 900 USD resistance:
„Well, another great call from our analytical team. Currently, the target is on the 300 USD, which are the lows from the September and October 2017. Chances that we will get there are very high. „

Our general opinion about the future direction was right – the price indeed declined. The anticipated target was not reached though. The decline stopped on the horizontal support, slightly above the 400 USD (yellow). Till the end of October, BCH was drawing a descending triangle pattern. This one ended at the beginning of November, when the price broke the upper line (black) of this formation. You can see that even despite today’s drop, the positive sentiment is still on. Today’s decline is an effect of the bounce from the orange horizontal resistance. In my opinion, the price should test this area again with a possible breakout to the upside.


Comments (0 comment(s))