Bitcoin Cash Analysis – new resistance on the 790 USD

If we would have to calculate our efficiency based on our articles, I would say that 90% of our predictions were spot on. Or even more. Time to deal with that 10%, were we made some mistakes. Today, we will talk about the Bitcoin Cash, which for the last time we analysed on the 5th of April. The price was around the 646 USD and we were bearish.
“Our target does not change. We see the price of the Bitcoin Cash much below the 400 USD, especially after the candle from yesterday which has a long head (shows us a rejection of the higher levels) and a large body covering the candle from Tuesday. Negative outlook will be denied once the price will climb back above the 910 USD but chances for that are now very limited. „
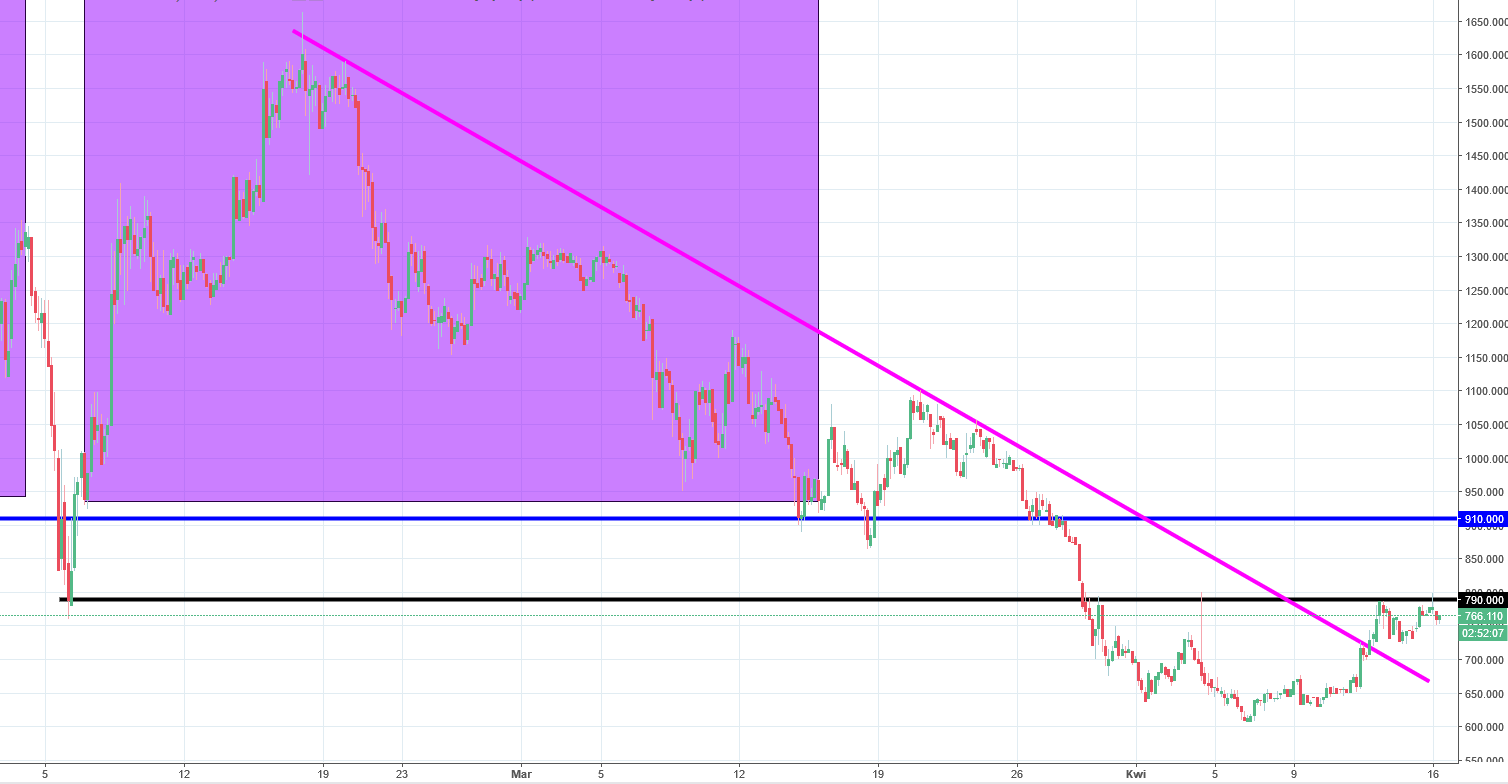
Yes, after our analysis was posted, the price did go lower – to the 607 USD but that was it. After that low was established, the BCH bounced and went higher. Is that a significant game changer? Not really. We did not broke any important resistances so far. Only one that we went through was the mid-term down trendline (pink) but the significance of this object is questionable. The price is stuck below the 790 USD resistance (black). That actually seems like a good place for a mid-term sell. 910 USD that we mentioned in our last piece is safe for now and the long-term sentiment remains negative.


Comments (0 comment(s))