BitShares Analysis – So close to 0.00 USD

The second analysis on Tuesday will be a small update of the analysis that we wrote on the 24th of May. Back in that day, the hero of the day was BitShares, which was having a very interesting technical setup. Although over those two weeks, the price did not change much (drop from 0.19 to 0.17 USD), we received an eye catching price action movement. In our last piece about this crypto, we wrote:
“Breakout of the lower line of the rectangle was in the same time the breakout of the neckline (pink), so in theory, the sell signal is very strong. „
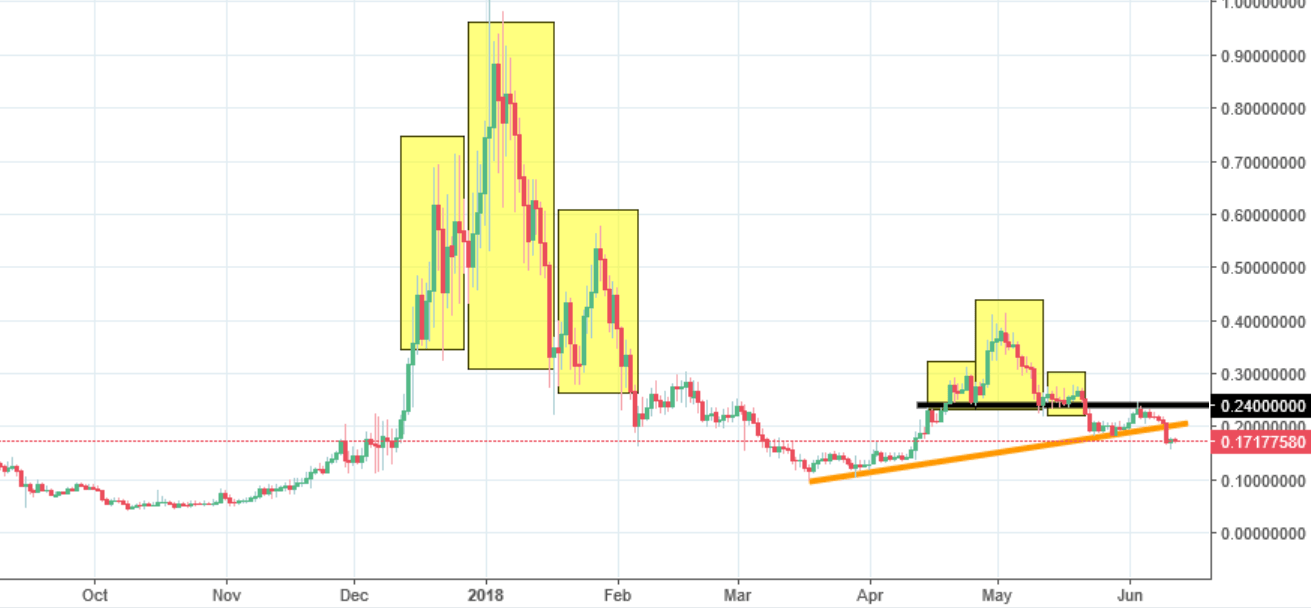
Sell signal was and is indeed very strong but most probably, we will see fruits just now, several days, after that signal was created. What changed after our previous analysis? The price tested the neckline of the head and shoulders formation (black) and the test was a bearish victory as the price went lower. In addition to that, we broke the mid-term up trendline (orange). The last action basically ends the bullish dream and forces the buyers to abandon any hope. Obviously if they still had any.
The current target for the BitShares are the lows from October, around the 0.04 USD and chances that we will get there this year are very high.


Comments (0 comment(s))