BitShares Analysis – Wedge points south
Tuesday is pretty bad for the crypto maniacs. Many coins are down more than 8% and the number of losers can be overwhelming. Well, I guess it is just another day in the life of the hodlers. Anyway, let’s start with the first coin for the day and this will be the BitShares. For the last time, we mentioned this coin on the 12th of June and we were bearish, saying this:
“The last action basically ends the bullish dream and forces the buyers to abandon any hope. Obviously if they still had any.The current target for the BitShares are the lows from October, around the 0.04 USD and chances that we will get there this year are very high.”
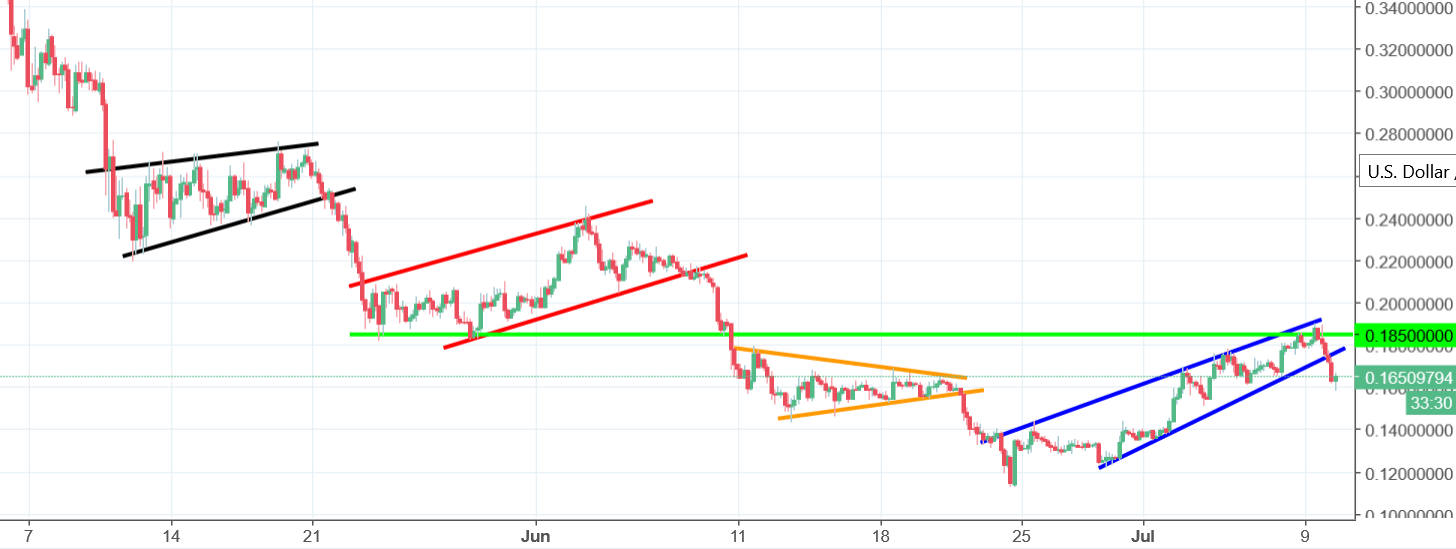
Back then, the price was around the 0.17 USD. Straight after, the BTS created a pennant (orange lines), which is a trend continuation pattern. On the 24th of June, the price reached local lows on the 0.11 USD. That was a great call!
After this, another trend continuation pattern emerged on the chart; wedge (blue lines). Wedge is already giving us a new sell signal as the price broke the lower line of this pattern, which is a trigger for that. In addition to that, we bounced from the resistance on the 0.185 USD (green), which was important in the end of May. The signal to go short is ON.


Comments (0 comment(s))