BlockNet Analysis – Two H&S patterns
Tuesday starts with the analysis of the BlockNet, which was previously mentioned by us on the 26th of May. Back in that day, the price was in the sideways trend and we were waiting for a breakout. Sideways movement was locked inside of the symmetric triangle pattern, but we also pointed at the high importance of the horizontal support and resistance levels:
“BlockNet has a resistance on the 22.5 USD (upper green) and the support on the 12 USD (lower green). Cautious and patient trader won’t go for the first breakout but will wait for the second one and this is my advice for this altcoin „
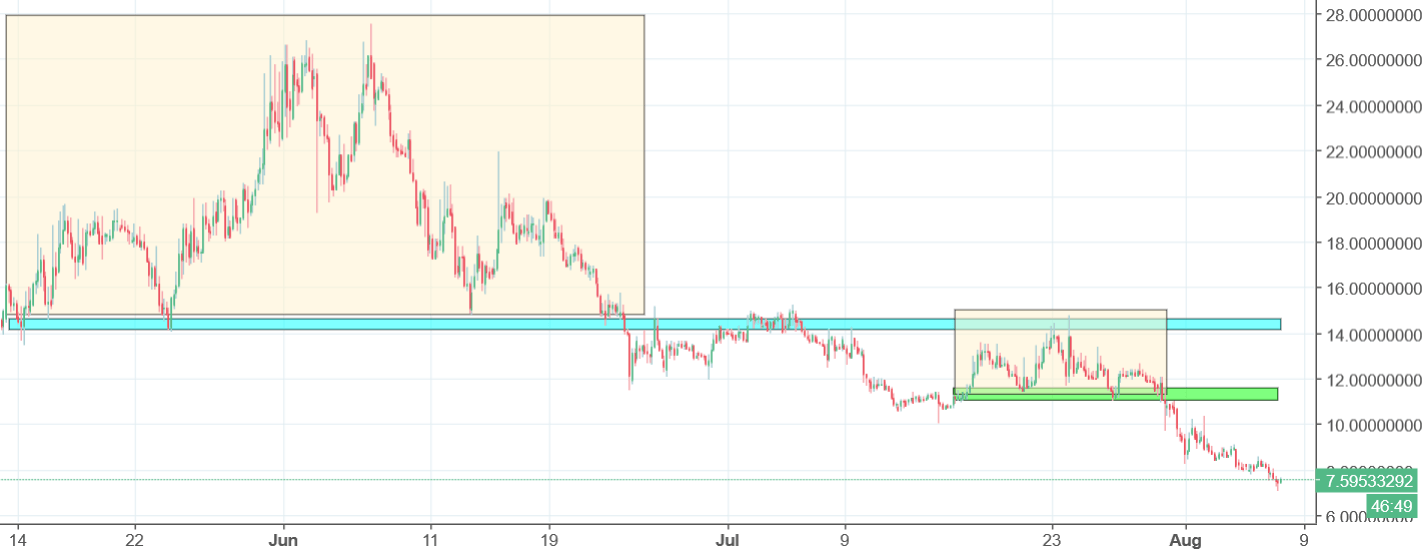
Crypto decided to break the upper line of the triangle and then, the resistance on the 22.5 USD. That gave us a technical buy signal and the price went higher. The only problem is that the upsing was not very spectacular and gave us only around 5 USD. After this, BLOCK went lower and created a bearish head and shoulders pattern (yellow). Price broke the neckline (blue) and created another H&S formation but this time much smaller. At the end of July, we broke another neckline (green), which gave us the most recent sell signal.
The sentiment is definitely negative and only the price coming back above the blue area can cancel this. Chances for that are now limited.


Comments (0 comment(s))