Cardano Analysis – Failed iH&S and a bearish triangle
New week starts with the analysis of the Cardano, so one of the biggest coins on the market. 20th of June, that is the day, when we wrote about this coin for the last time. Back then, the price was around 0.158 USD and our sentiment was bearish:
„As we can see, buyers made an attempt to break the mid-term down trendline (red). That try is so far successful but that should end soon. The current drop looks strong and the chances to see the further decline are much higher. „
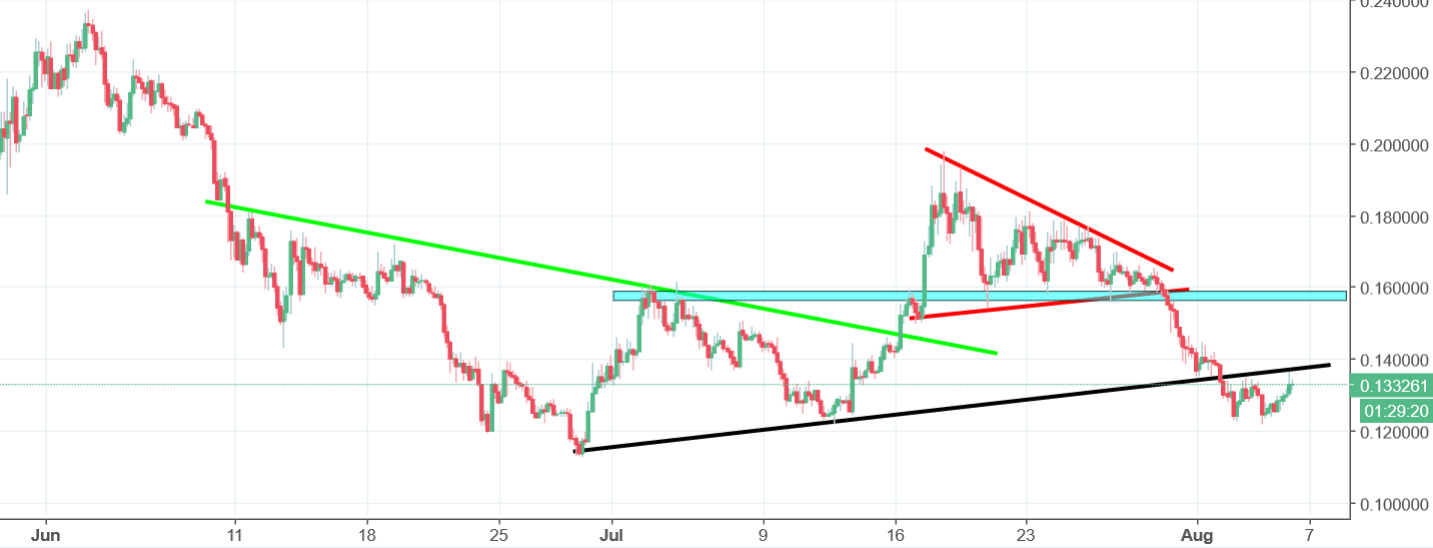
9 days later, we were already on the 0.11 USD. That is the place, where the ADA started a bullish correction. Technically, it was strengthened by the inverse head and shoulders pattern. Which on the 16th of July, resulted with a breakout of the neckline. The upswing wasn’t the strongest one. The price went higher but that was just the correction, not the trend reversal expected by the hodlers.
Optimism definitely vanished at the end of July, when the price broke the lower line of the triangle and went below the support on the 15.8 USD (blue). In addition to that, few days ago, ADA broke the mid-term up trendline (black), which is directly responsible for the sell signal. This line is currently being tested as a resistance and a bounce will be a confirmation of the mid-term sell signal.


Comments (0 comment(s))