ChainLink Analysis – 0.6 USD can be problem here

Wednesday starts with the analysis of the Chain Link, which was previously mentioned here on the 16th of September. Back in that day, we were optimistic but we warned that, for the buy signal, we need to wait for the breakout of the certain resistance:
„The sentiment is positive but watch out for the horizontal resistance on the 0.35 USD. Maybe it would be better to wait with the buying for the breakout of this resistance first. „
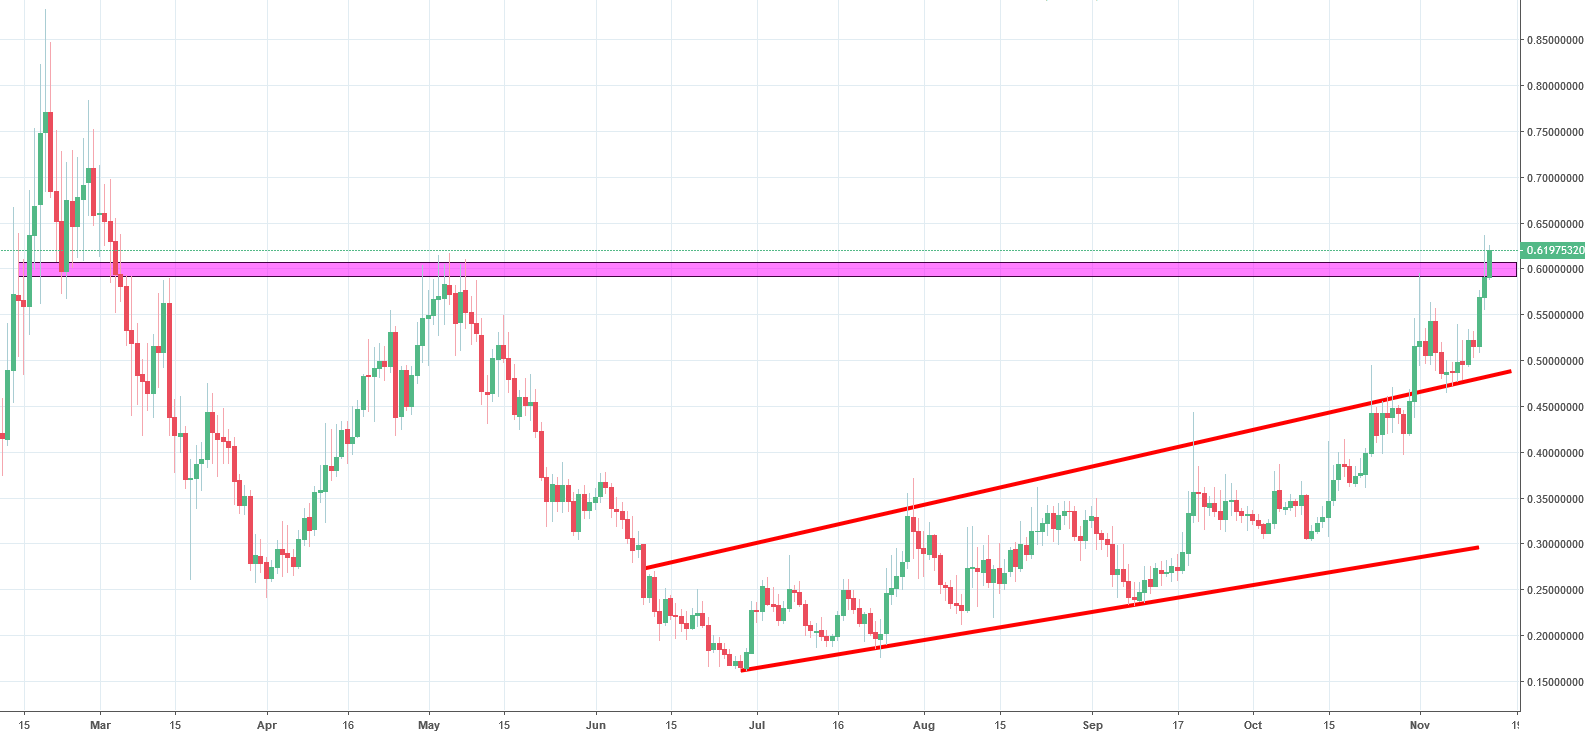
That resistance was broken one month later! But we were right. After the breakout, the price just surged higher. Yesterday, the price made new long-term tops and we were on the highest levels since the beginning of March. Watch out though! The daily candle from yesterday is a shooting star with a long tail on the 0.6 USD resistance (purple). That area seems like a good place for a take profit action. The new buy signal, will be triggered, when the price will close the day above the pink area. We are on a good way to do this but it requires just a bit of patience.


Comments (0 comment(s))