ChainLink Analysis – 16% up!

Wednesday starts with the analysis of the Chainlink – a crypto which was here only once, on the 25th of July. Back in that day, we were bearish, as the price was in a proper down trend and was bouncing form a strong bearish resistance:
„Breakout to the downside is more probable as the resistance on the 0.25 USD got rejected today, which is now shifting the situation towards the further drop. „
Unfortunately, our scenario did not happen and the price went higher. In the past two months, the price created two patterns: a flag (blue lines) and a symmetric triangle (red). At the beginning of September, LINK, broke lower lines of those formations, which in theory, brought us a sell signal. Just in theory though as that signal is being currently denied.
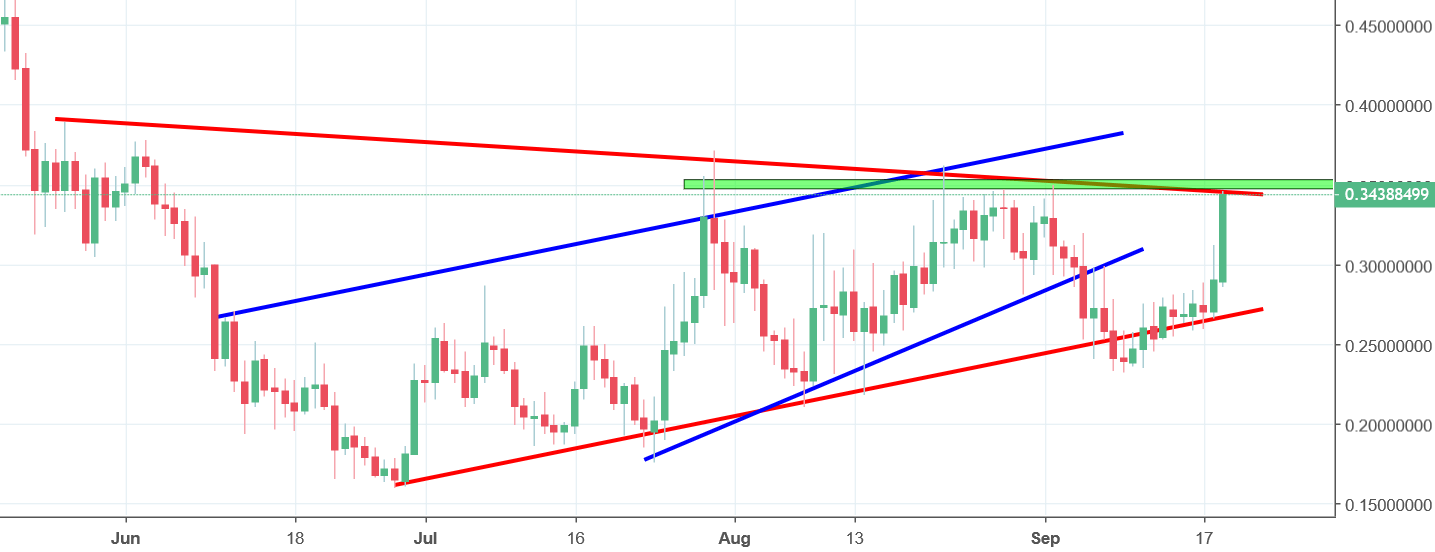
What we have here is a typical false breakout pattern, so we should not be surprised with today’s reaction, which is a 16% upswing. The sentiment is positive but watch out for the horizontal resistance on the 0.35 USD. Maybe it would be better to wait with the buying for the breakout of this resistance first.


Comments (0 comment(s))