Civic Analysis – That can hurt

Now, time for Civic. We did analyse this coin previously but not against the USD as usual but against the Bitcoin. We did that on the 29th of May and back in that time, the price was inside of the symmetric triangle pattern and was aiming south, our view was negative and we wrote this:
“Current situation looks more bearish, so there are more chances for the drop, especially after the candle from yesterday, which has a long head and touches the upper line of the triangle. This shows us the rejection of the higher levels and a willingness to go lower. Before opening the short position you should wait for the breakout of those two: lower line of the triangle but also the horizontal support market with a black line. „
As I said, today we will analyse CVCUSD not the CVCBTC but we need to mention that our scenario happened and the price went significantly lower. Actually, almost all days, after those words were published, were bearish. Hurray!
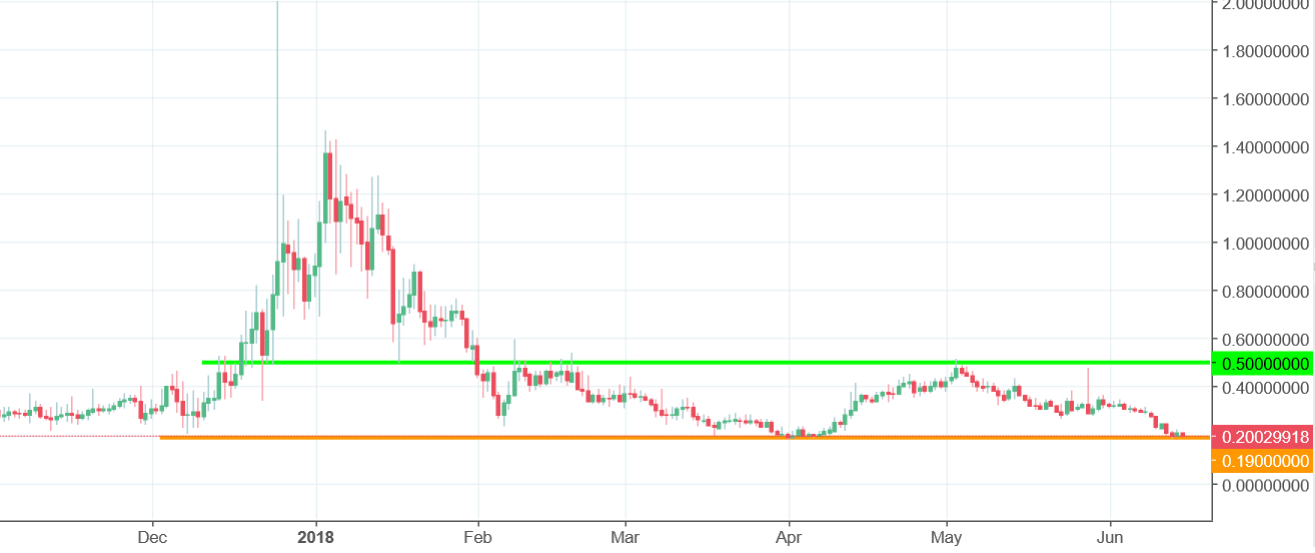
OK, the situation on the CVCUSD is not better. The price bounced from the resistance on the 0.5 USD and went towards the horizontal support on the 0.19 USD (orange). That can be a place, where the price can bounce but chances for that are limited. That is just a theoretical support. CVC is currently putting constant pressure on that level, which shows us a huge bearish potential. Breakout to the downside is currently more probable and we think that the price should make new long-term lows very soon.


Comments (0 comment(s))