Civic Analysis – Testing an important resistance
Now, time for Civic, which was previously mentioned on the June 15th, when the price was around 0.2 USD. Back in that day, we were bearish, even despite the fact that the price was above a strong horizontal support:
“CVC is currently putting constant pressure on that level, which shows us a huge bearish potential. Breakout to the downside is currently more probable and we think that the price should make new long-term lows very soon. „
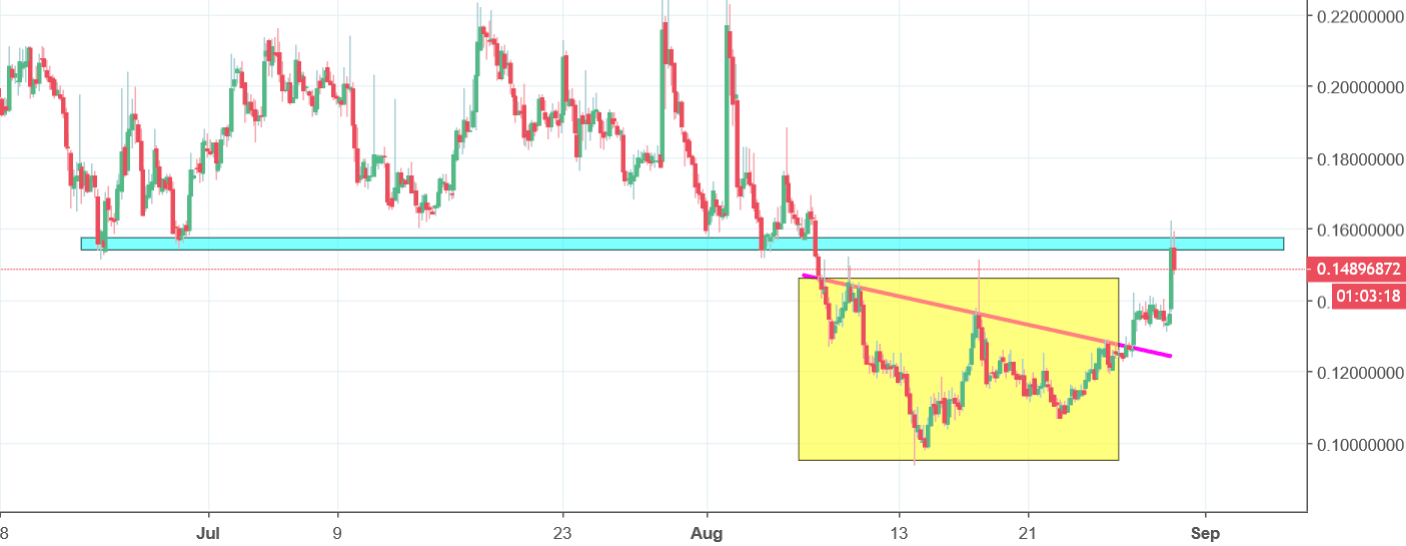
It was a great analysis. That support was broken relatively easy. Later, the price created another one (0.15 USD blue) and this one was broken too, on the 7th of August to be precise. In the middle of this month, the price reached a bottom, slightly below the psychological barrier of 0.1 USD. So as you can see, 50% lost in value! Not that we did not warn You!
0.1USD was the place, when buyers decided to step in. The price formed an inverse head and shoulder pattern (yellow) and climbed higher. Bullish momentum increased, which allowed to test the blue resistance. Today, the price is almost 10% higher, so the buyers are back on the market. Breakout of the blue line will be a confirmation of the buy signal. Bounce from this line will delay the positive sentiment. At least for some time.


Comments (0 comment(s))