Dash Analysis – 200 USD on the horizon

Second piece will be about the Dash, different altcoin but some things stay the same: our previous analysis about this crypto was spot on! For the last time, we wrote about Dash on the 26th of May, when this coin was trading around 337 USD. We were bearish saying:
“Current situation looks really bad. Some traders maybe do not agree and they see a bullish wedge but in my opinion this wedge is more a channel down formation. What is the difference? Well, wedge is a trend continuation pattern and suggests us a further upswing and channel down, no surprise here, promotes a further drop „
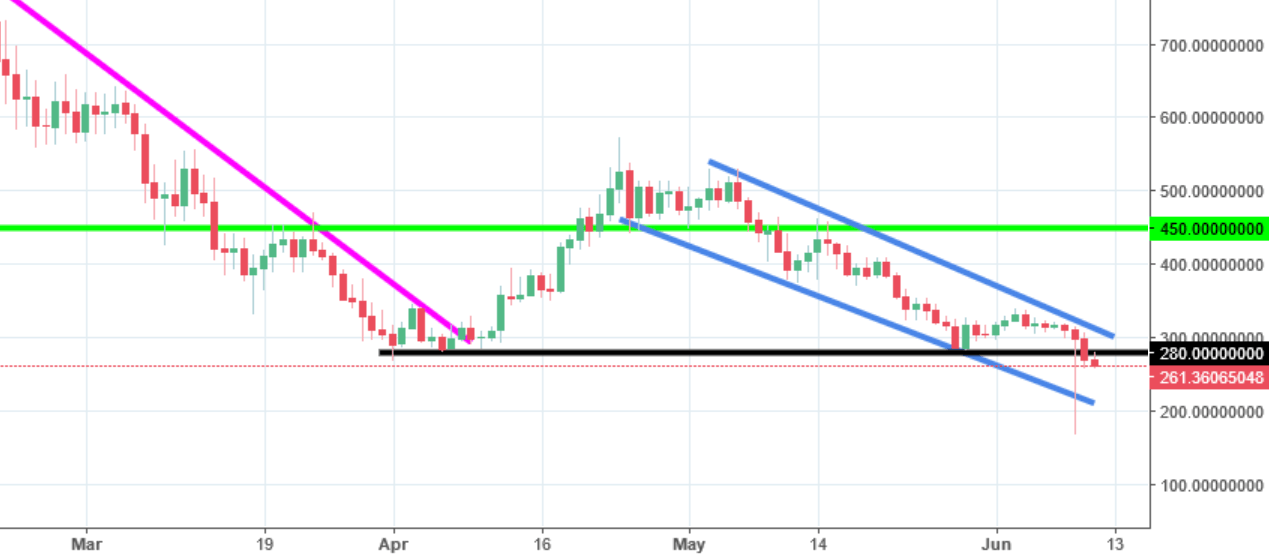
Yes, it was a channel down formation, not a wedge. The price did not break the upper line of this pattern. Instead of that, Dash continued to decline reaching 260 USD today. Actually, we went even lower! On Saturday, the price declined sharply breaking the psychological barrier on the 200USD but the movement was not sustainable and Dash quickly reversed. Technical significance of that sharp decline is questionable so we will not focus on that. Currently, the most important horizontal level is the 280 USD (black line) and is a mid-term resistance. As long, as we stay below this level, the sell signal is on and the price should continue to decline.
For now, the closest target is on 200 USD and we should get there relatively soon.


Comments (0 comment(s))