Decred Analysis – Broken line of the pennant

The last piece of the day will be about the Decred. Previously, we wrote an analysis about this coin on the 13th of June and we were bearish. Back then, the price was around the 89.5 USD and we pointed at the bearish Head and Shoulders formation:
“Since that, the price created a head and shoulders pattern (yellow rectangles), which along with the flag mentioned above, promotes the further drop. The trigger point does not change – it is still the horizontal support on the 80 USD. As long, as we stay above, further decline is only theoretical. Only the breakout of the green line will give us a legitimate permission to go short. „
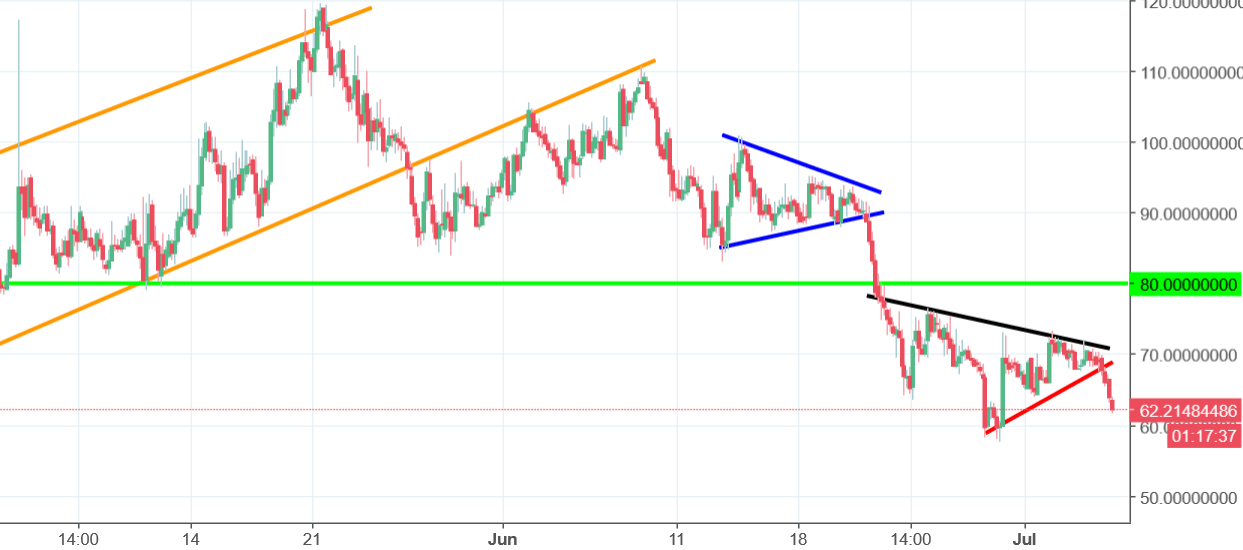
That was a great piece of advice! Now, the price is around 61.9 USD and today, we are going down around 7%. Since those words were written, the price was mostly going down, in the meantime, creating two correction patterns – pennants. The second one, at some point, was an inverse head and shoulders formation but the price failed to break the neckline (black). Failed attempt to go higher is an invitation to go to the opposite side – lower.
After the breakout of the lower line of the pennant(red), there is only one direction and it is south. The sell signal will be denied, once the price will climb back above the green line, which for now, is less likely to happen.


Comments (0 comment(s))