Emercoin Analysis – Short-term bullish correction
Thursday starts with the analysis of the Emercoin, which was previously mentioned at the beginning of July. Back in that day, quite surprisingly, the situation was bullish. We acknowledged the breakouts of important resistances and we were positive in the mid-term:
„As You can see, we do have a bullish momentum here and there should be no surprise that we do have 4 green days in a row. That can be actually just a beginning as we do not have any significant resistances ahead. The buy signal is on as long as we stay above the support on 2 USD (green). „
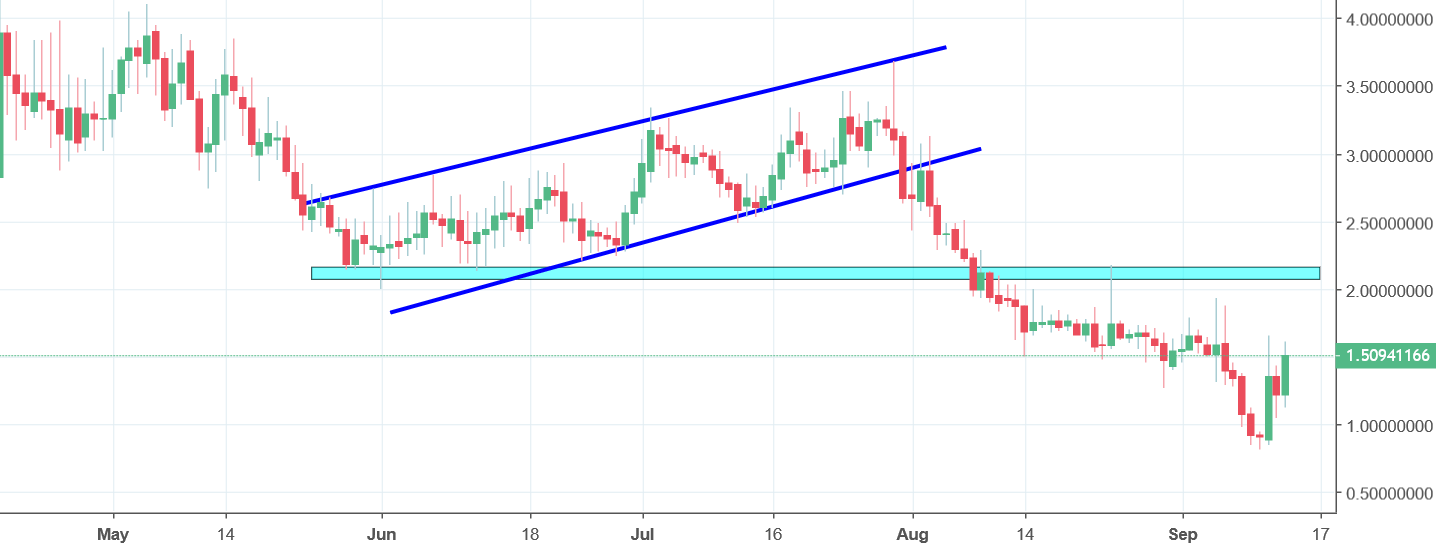
Emercoin was making higher highs and lows till the beginning of the month, reaching local highs on the 30th of July. That whole upswing was just a bigger flag pattern (blue), which in a big picture, was promoting the long-term down trend. The 2 USD support that we were talking about back then was broken on the 8th of August and that gave us a proper sell signal, which lasted till the 10th of September. Since that, we do have a nice 3 days upswing, which increased the value of the EMC for more than 50%. Short-term sentiment is positive and in our opinion, the price can reach the 2 USD resistance relatively soon.


Comments (0 comment(s))