Ethereum Analysis – Always can go lower…always

Winter was coming for the crypto traders and winter finally came. New long-term lows on the vast majority of the instruments is a fact. In this piece we will talk about the Ethereum, which was previously mentioned here on the 19th of November, when the price was around the 160 USD. Back in that day, we were already touching the floor with our forehead but it did not stop us from being even more bearish:
„Today, ETH is breaking the bottom from September and is setting new yearly lows. Hopefully you read our piece from October and You did not buy ETH after that single day rise. The sentiment now is totally negative and ETH is the instrument that you should stay away from. „
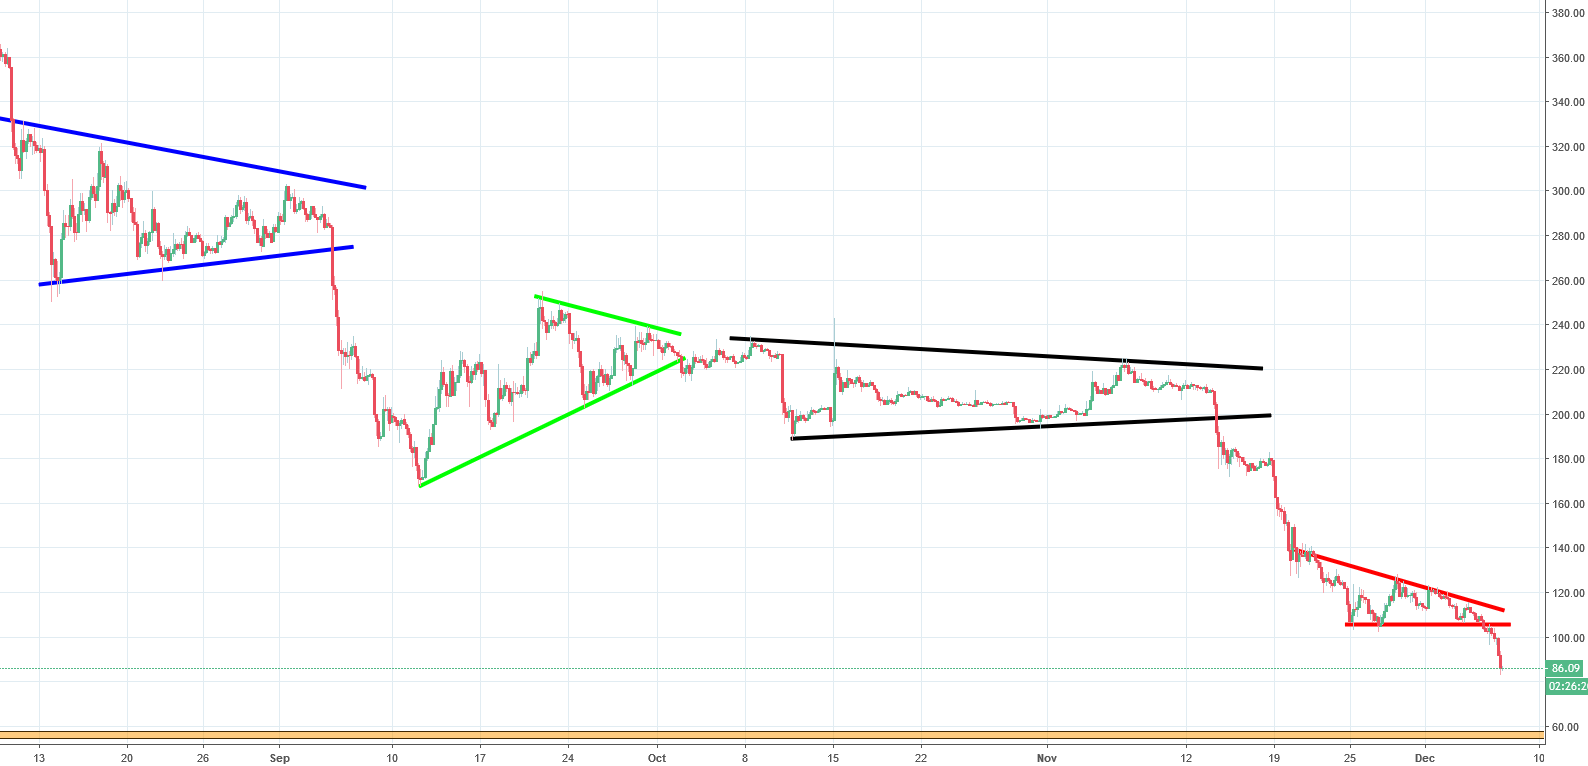
Well, now ETH costs half of the price that we saw then. You always can go lower, right? The most recent technical formation that we got was a descending triangle (red). The formation resulted with a breakout of the lower line of this pattern, which was largely anticipated. Now, the aim is on the orange support, slightly below the 60 USD. This was an important resistance in March and April 2017, so why do not test it as a support now?


Comments (0 comment(s))