Ethereum Analysis – Bullish correction is over

We start with the situation on the Ethereum, which is having a fresh sell signal. That should end the bullish correction that could have been seen here since the 12th of September. Interestingly, that is the date, when we analysed this instrument for the last time. Our outlook was very negative:
„The target for now is around the 140 USD, so the important levels from May and July 2017. Chances that we will get there are quite high. „
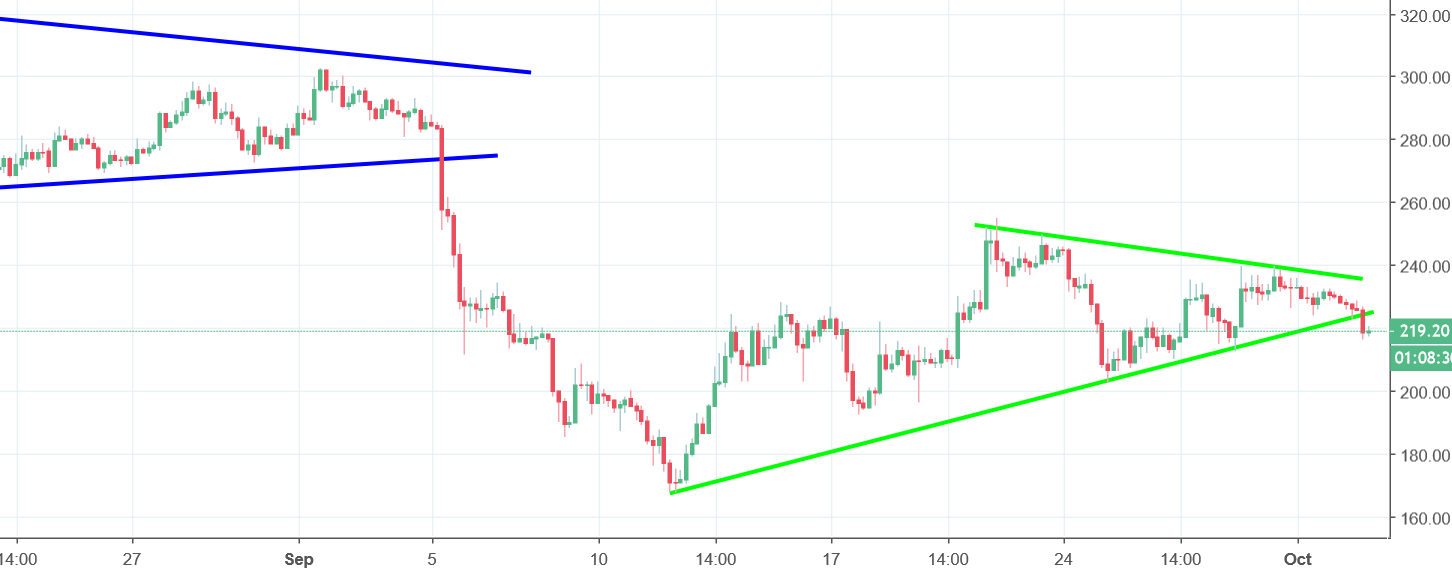
Instead of going lower and reaching this target, the price entered the correction stage and went up. Does that cancel our negative view? Not so much, this outlook is rather delayed in time and the price movements from today are a perfect example of that. What is happening here is that the price broke the lower line of the bullish correction (green), which in the same time can be considered as a neckline of the Head and Shoulders pattern. Price closing a day below the green line will be proper signal to go short. The potential target here are the lows from September and further, 140 USD mentioned in the previous piece.


Comments (0 comment(s))