Ethereum Analysis – ETH meets horizontal support

For the start of this week, we prepared three cryptos from the top of the list. First one will be the Ethereum. The last time I wrote a piece about the ETH exactly a week ago, when the price was around the 700 USD. We were bearish but I said that there was no sell signal there yet and that traders should wait for the breakout of the mid-term, dynamic support, which around that time was close to 670 USD:
“Situation looks bad but there is no sell signal here yet. For this, we should see the breakout of the lower red line first. Only this will trigger a legitimate signal to go short. „
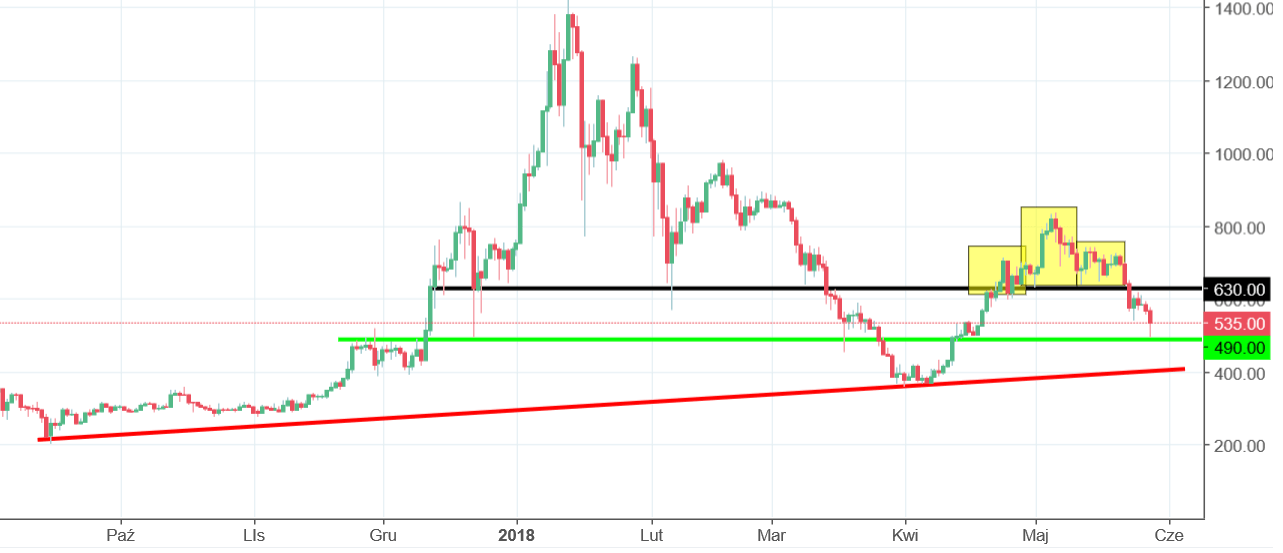
The breakout happened a day after those words were written and the ETH entered the bearish territory with a strong sell signal. In this analysis we focus on the daily chart (previous one was on the H4) and we see that the recent price movements formed the head and shoulders pattern (yellow) and that the price broke the neckline and then tested that as a resistance (black horizontal line on the 630 USD). Another great call from the ForexNewsNow analytical team.
Today, the price reached the horizontal support on the 490 USD (green) and we can see a long tail on the daily candle indicating a bullish counter attack. If the long tail will hold till the end of the day, we may see a upswing in the next few days. If not, bearish scenario will remain in place with the target on the red up trendline.


Comments (0 comment(s))