Ethereum Analysis (ETH) – Two hammers on the suppport!

Time for another good call that we made quite recently, this time on the Ethereum. We wrote a piece about this crypto on the 2nd of May , when the price was around the 682 USD. We said that the target for the upswing is the 800 USD:
“Today’s price action suggests us that we are getting ready for a major upswing and that the ETH will soon test the resistance on the psychological barrier of 800 USD (red). „
The upswing happened exactly one day after this analysis was published on our website. The price broke the resistance of the mid-term correction pattern and surged higher. 800 USD was respected just for a while, during the first contact but after that it got broken quite easily and the price topped around 840 USD. Those levels triggered the taking profit action, which we could see till now.
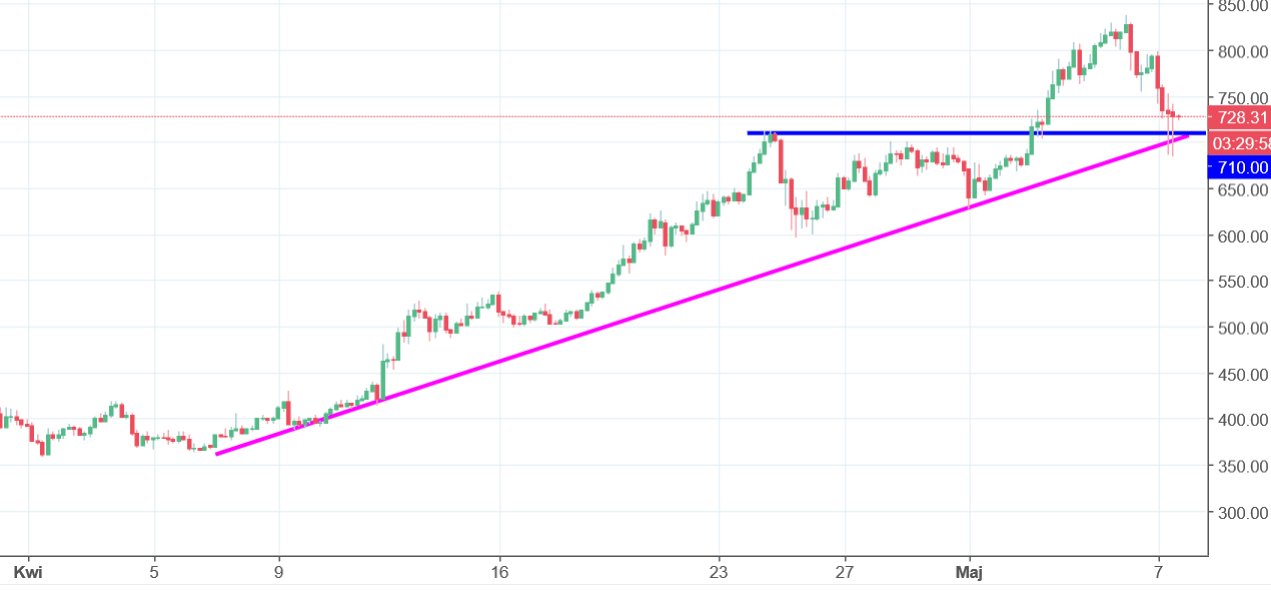
Currently, we do have some evidences that we are coming to an end of this bearish correction and that we should see a further rise. The price created two hammer candles on the combination of two important supports: horizontal (710 USD) and a dynamic one (mid-term up trendline). This kind of a price action is usually a strong invitation to buy. I would be surprised if this time it would be different.


Comments (0 comment(s))