Ethereum Analysis – False Breakout is near

Now, time for the Ethereum, which for the last time, was analysed by us on the 28th of May. Back in that day we were optimistic and we were looking for a start of a new bullish correction. That is precisely what happened and since our last piece about the ETH was written, this coin was only climbing higher. Here is the quote from our last piece:
“Today, the price reached the horizontal support on the 490 USD (green) and we can see a long tail on the daily candle indicating a bullish counter attack. If the long tail will hold till the end of the day, we may see a upswing in the next few days. „
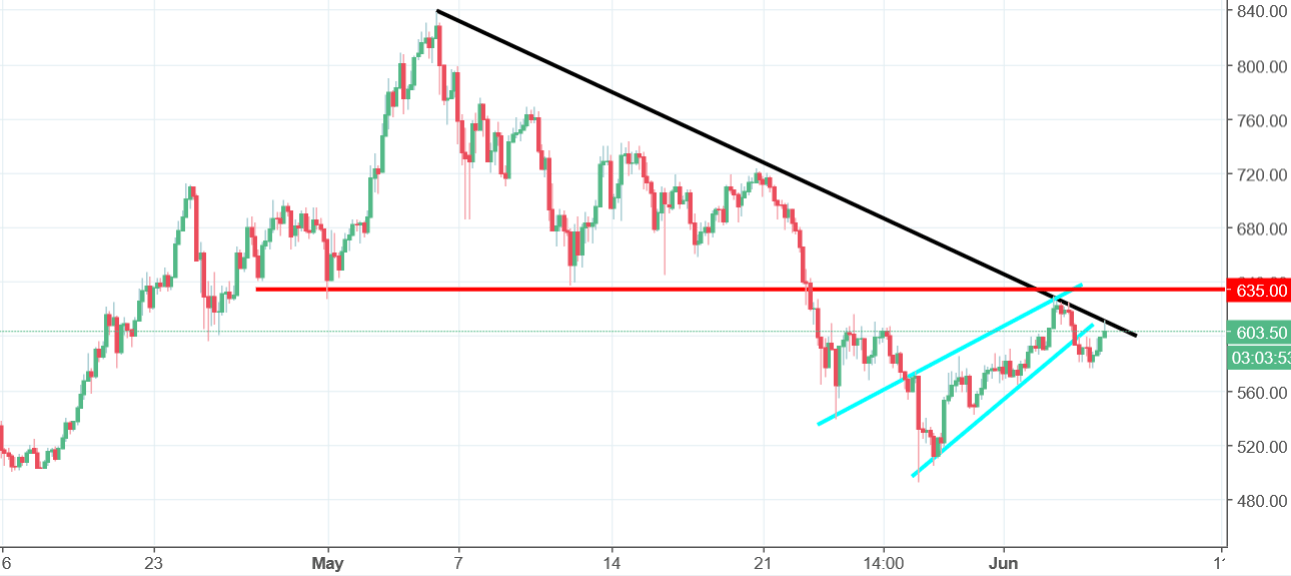
OK, so we do have an expected bullish reversal but is it a start of something bigger? If we consider only price movements excluding those from today, we would be bearish. The price bounced from the down trendline and broke the lower line of the flag. Both of those factors are bearish but today the price is not following that and is climbing higher. That can mean a false breakout pattern.
False breakouts are usually very strong formations and in this case, can mean a significant upswing. For the proper buy signal we need to wait for the breakout of the black down trendline. Once it will happen, long positions will be in play.


Comments (0 comment(s))