Factom Analysis – Best crypto at the moment

Thursday starts for us with the analysis of the Factom, which we previously wrote about on the 5th of September, when the price was on the 6.81 USD. Back in that day, we saw a flag and we were bearish. Was that a good call? Yes it was splendid but first let me show you how we concluded the previous piece:
“Most recently, we do have a flag formation (blue lines), which is promoting a further decline, especially that we are under the horizontal resistance on the 8.3 USD (orange). With this setup, we should soon see the breakout of the lower blue line and a further decline. „
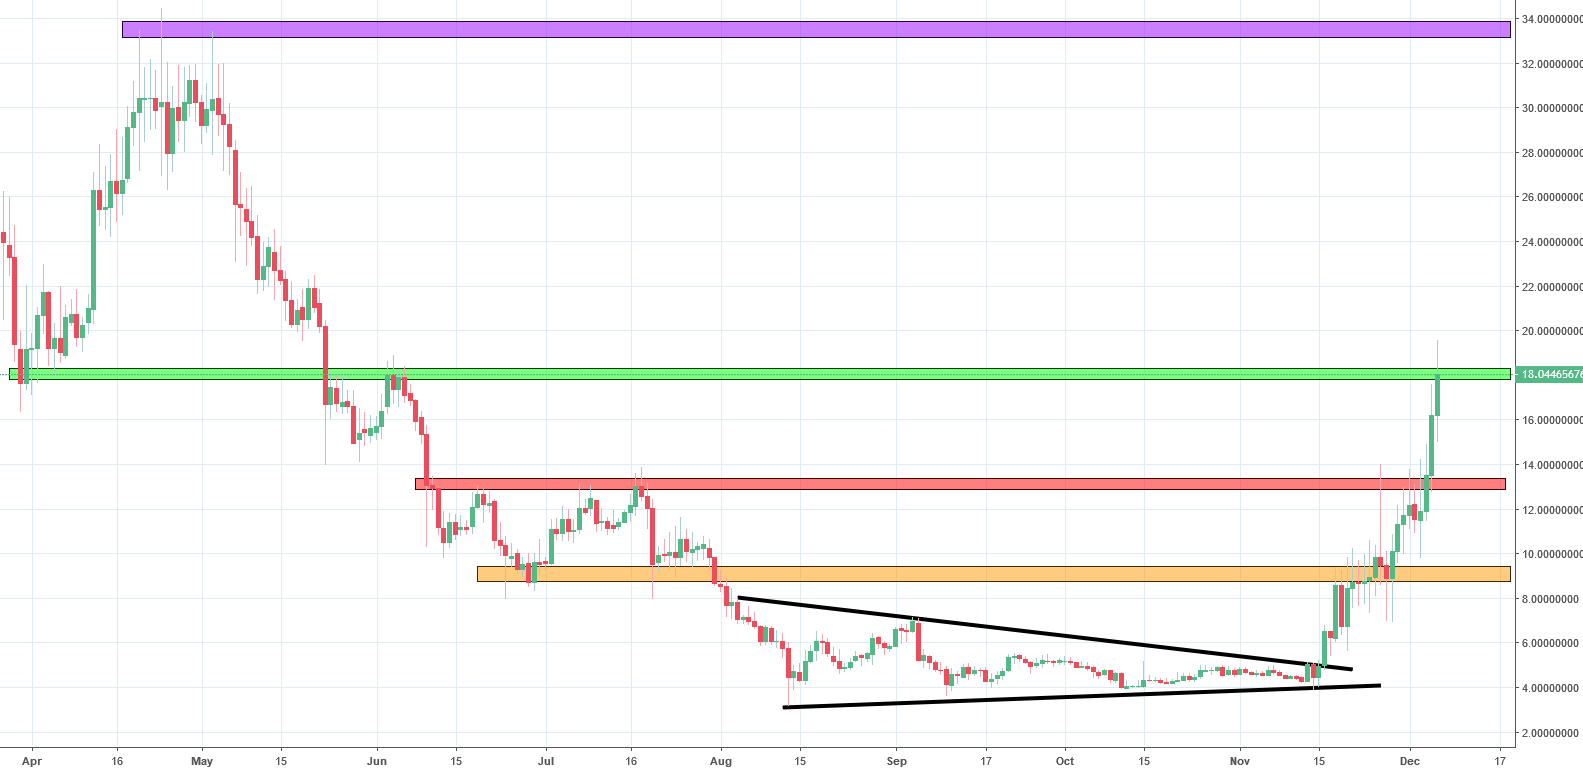
The price broke the lower line of the flag almost immediately after those words were written. In the next few days, the price declined from 6.81 to 3.72 USD. I think that this kind of drop is significant! During October, the FCT created a triangle formation (black). This one resulted with the breakout of its upper line, which gave us a super strong buy signal. As you can see, FCT broke already two crucial resistances (orange and red) and is currently challenging the third one (green). That can be a good occasion for a small bearish correction but we do not know if that will happen with the momentum like that. As for now, the price is over 10% higher and it seems that currently, FCT is the only instrument on the crypto market, where you can see the optimism.
With all this, we should see the price on the purple resistance relatively soon.


Comments (0 comment(s))