Golem Analysis – Bearish flag and a resistance

Yesterday, Bitcoin finally ended the sideways trend that was present on the chart for the past two weeks. That brought us a nice sell signal but today, we will mention other instrument – Golem, where we are almost 5% higher. Is the situation here totally different from this seen on the BTC? Not so much, On both instruments it is hard to think about buying right now. First, let me show You, what I wrote in the previous piece of this instrument:
„In the past few day, GNT is more in a sideways trend than the reversal mode, which can be a bearish factor here. In my opinion, a further decline is very probable here and even despite that hammer, we do not have good conditions for buying. „
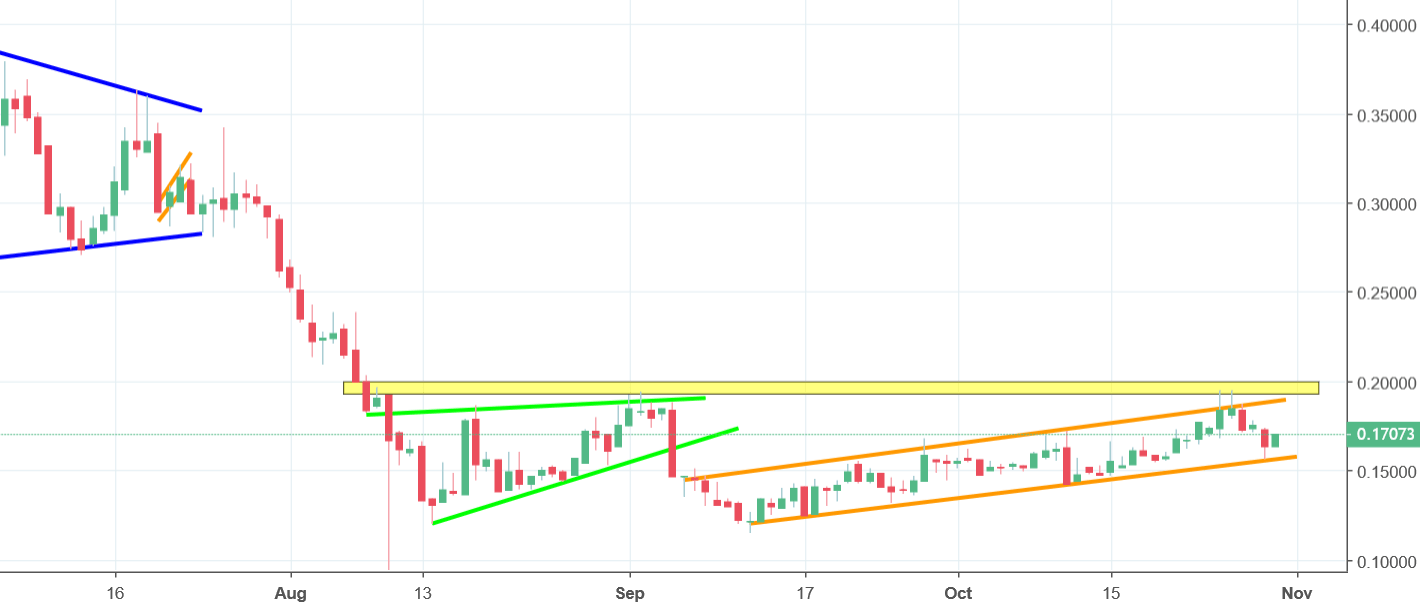
No surprise here, the price did exactly what was expected, so did not go higher and aimed for the new long-term lows. Since the mid of September, we do have a correction, which is shaped like a flag (orange lines). That is a bearish pattern, so we should experience a bearish breakout. As long as we stay below a psychological barrier (and a legitimate resistance) on 0.2 USD (yellow) the sentiment is negative and we cannot see any reason to buy this coin.


Comments (0 comment(s))