Golem Analysis – We had a hammer but buyers are still weak

Second piece of the day is the Golem, which was previously mentioned on our portal on the 23rd of July. Back in that day, we were inside of the symmetric triangle pattern. When the price is inside of this formation, this is the worst place to trade. For the proper signal, you need to wait for the breakout first and that is what we said in that piece:
“Triangles can result in a continuation or a reversal so one should not open a position, when the price is inside of this pattern. I would prefer to wait for the breakout first. Breakout of the upper line will give us a buy signal and the breakout of the lower line, will give us a sell. „
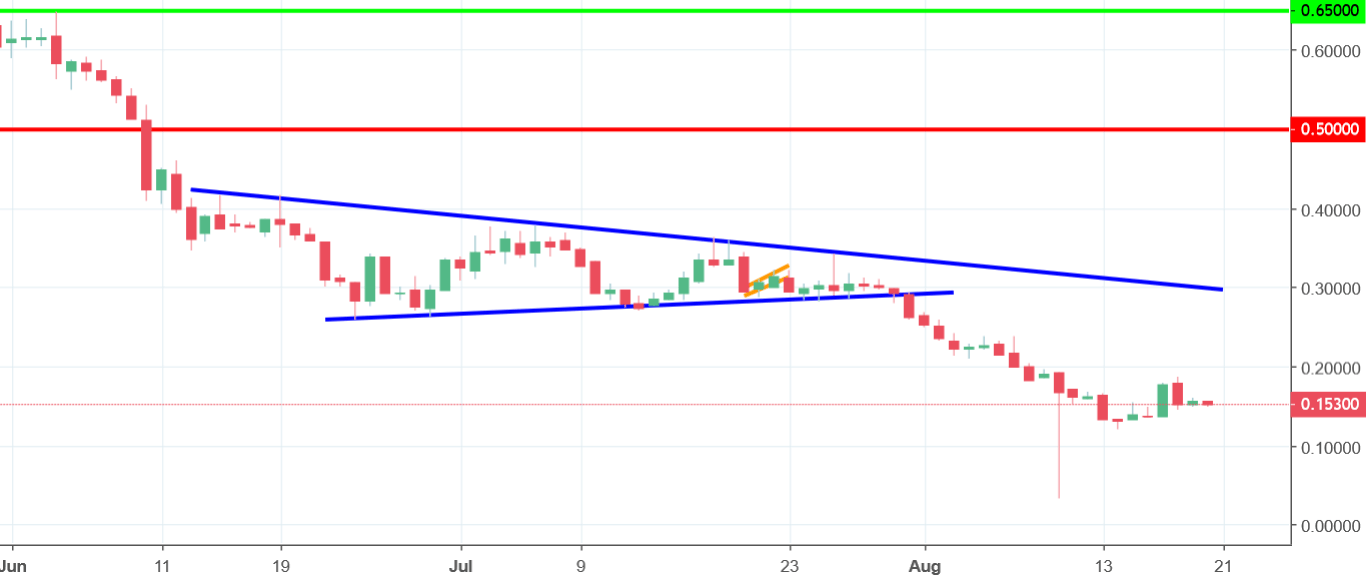
The breakout happened at the end of July and the price declined from almost 0.3 to 0.03 USD. Well, that is the power of the breakouts and the power of the price action trading. If you were patient enough and read our analysis, you could have save a lot of money. On the 10th of August, the price created a hammer on the daily chart. Candle has a very long tail and shows us a rejection of the lower levels. In theory, that should bring us a strong reversal but the price is not following that.
In the past few day, GNT is more in a sideways trend than the reversal mode, which can be a bearish factor here. In my opinion, a further decline is very probable here and even despite that hammer, we do not have good conditions for buying.


Comments (0 comment(s))