Golem Analysis – Triangle keeps both ways opened
Last piece of the day is Golem. Previously we mentioned that on the 30th of May. We were positive about this altcoin, seeing the possible upswing towards the resistance on the 0.65 USD. That is what we said:
“As we can see now, that last breakout was false and the price came back above red area. False breakouts are usually a very reliable patterns and in this case, they should give us a strong buy signal aiming at least the resistance on the 0.65. „
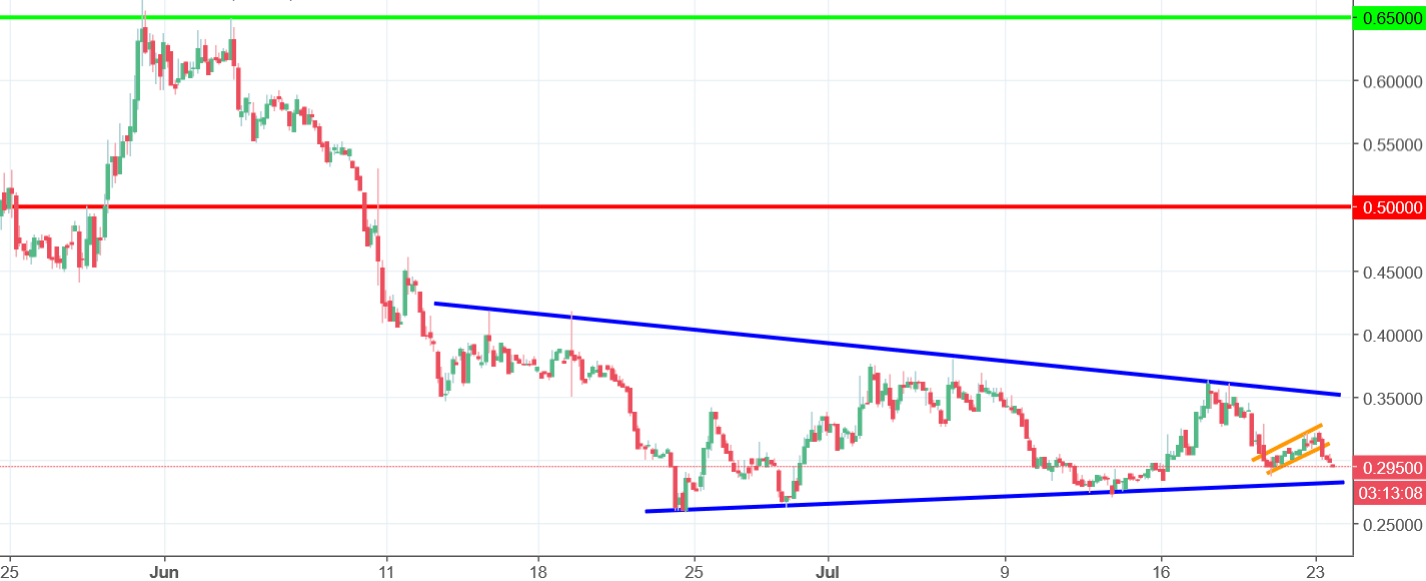
Back in that day, we were on the 0.55 USD and we reached our target in the blink of an eye. That was super fast and the analysis was good. It was even better if You will look at the chart. 0.65 USD is the place where the bounce stopped and the price totally reversed! Just perfect! From 0.65 USD we declined towards the 0.26 USD – seen on the end of June.
Currently, the price is creating a symmetric triangle pattern (blue lines). Triangles can result in a continuation or a reversal so one should not open a position, when the price is inside of this pattern. I would prefer to wait for the breakout first. Breakout of the upper line will give us a buy signal and the breakout of the lower line, will give us a sell.


Comments (0 comment(s))