Golem Analysis – False Breakout to the rescue
The last analysis of the day will be about the Golem, which for the last time, was analysed by us on the 25th of April. When, we wrote the previous analysis, the price was around the 0.52 USD and was bouncing from the support on the 0.5 USD. We acknowledged that area and were quite optimistic about the future:
“That is possibly a negative signal but the thing is that we are still above the 0.5 USD support. As long, as we stay above this support, the sentiment is positive and we should see a continuation of the upswing. Price closing a day below that area will deny the buy signal. „
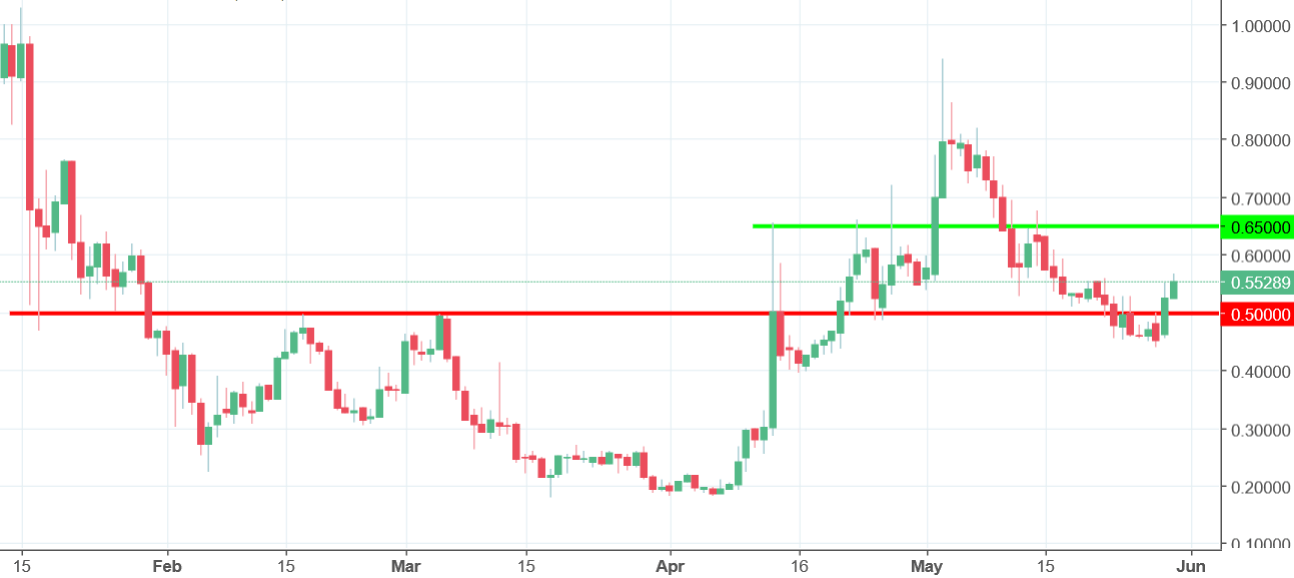
For the next few days, after those words were written, the price did go higher. Actually, on the 3rd of May, we almost doubled and the price reached the 0.93 USD. That was a great trading opportunity! After that, the correction time came and the price declined sharply, breaking even the support on the 0.5 USD.
As we can see now, that last breakout was false and the price came back above red area. False breakouts are usually a very reliable patterns and in this case, they should give us a strong buy signal aiming at least the resistance on the 0.65.


Comments (0 comment(s))