Golem Analysis – Two flags in a row

Tuesday starts with the analysis of the Golem, which currently is one of the biggest losers. Golem is very popular on our portal, we already mentioned this altcoin few times. The last one was on the 23rd of November. On that day, we were bearish, looking for a further drop:
„Sentiment here stays negative as long as we remain below the red area. Price coming back above the red area can be a start of a new up trend but is less likely to happen. „
We can say that our analysis was definitely spot on. The technical situation here was very interesting. First of all, after those words were written, the price tested the red area twice. Both of those tests were unsuccessful, which only proves the bearish determination. What is more, those testes were the part of a flag pattern (black lines). If you look on the chart, you will see that we already had a flag here and it also gave us a proper sell signal – technical beauty.
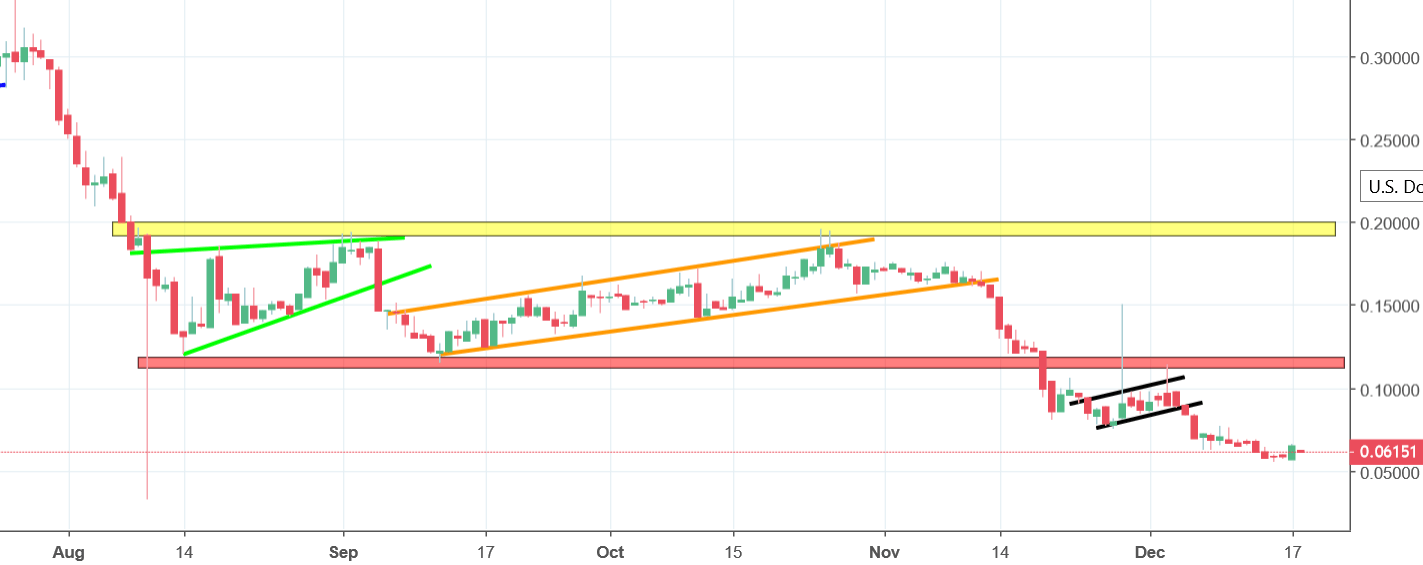
Golem tried a reversal yesterday (as almost whole market) but Tuesday brutally verifies it. If the buyers will not be able to recover today, we should soon see the new long-term lows here. Our view remains negative.


Comments (0 comment(s))