IOTA Analysis – Freefall towards 0.16 USD

Tuesday starts for us with the analysis of IOTA, which today is one of the biggest losers among major cryptos. In the middle of the European session, we are down over 13% and it does not look like the end of this story. The previous piece about this altcoin was written on the 24th of September and back then we were bearish:
“Currently, we are inside of the symmetric triangle pattern (blue, green). The main trend is bearish so we do have higher chances for a further drop, especially with today’s decline. The sell signal will be triggered, when the price will break the green line. “
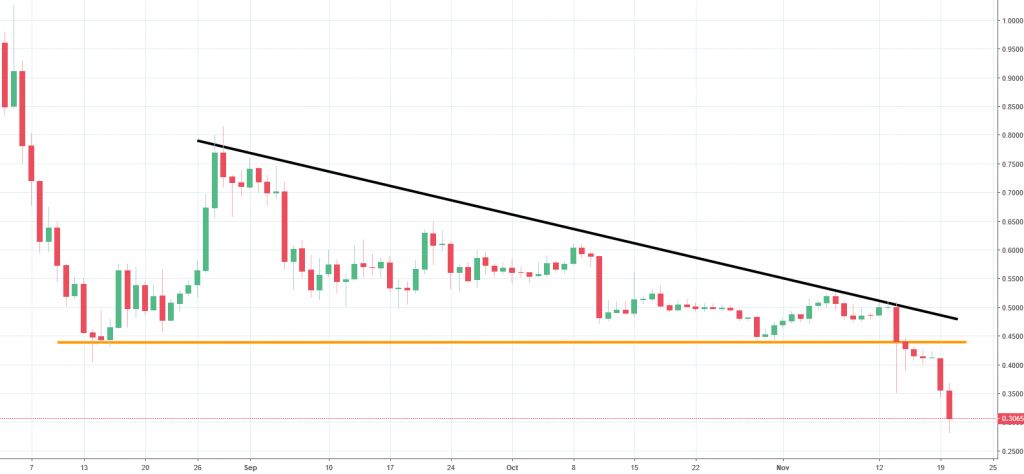
That was a great piece of work. The price indeed went lower, almost straight away to be honest with you. The decisive blow here was done few days ago, as the price broke the lower line of the descending triangle pattern (orange). That sorted out the sentiment and allowed the IOTA to drop towards the lows from the end of October 2017. Those do not act as a support so the price is free to go even lower. The potential target here are the lows from July 2017 around 0.16USD. With the current momentum, chances that we will get there are quite high.


Comments (0 comment(s))