IOTA Analysis – Monday’s hammer sets the bullish sentiment

The second analysis on Wednesday will be about the IOTA. For the last time, we wrote a piece about that crypto on the 18th of April, when the coin was trading around the 1.6 USD. We were very bullish and our view was perfectly described here:
“The sell signal got cancelled on the 12th of April, when the price came back above the green line. After that, the time for the buy signal came and that one was triggered on Sunday, when the price broke the 1.45 resistance. Currently, that will be the closest support. IOTA is making higher highs and higher lows and that means that the trend has changed and now, it is a good time to make a purchase. „
The current price is 2,33 USD so you can see that it was another great call from our analytical team. What is more, after the last analysis was written, the price was mostly climbing higher, creating higher lows and highs, showing a great respect towards the main principles of the technical analysis.
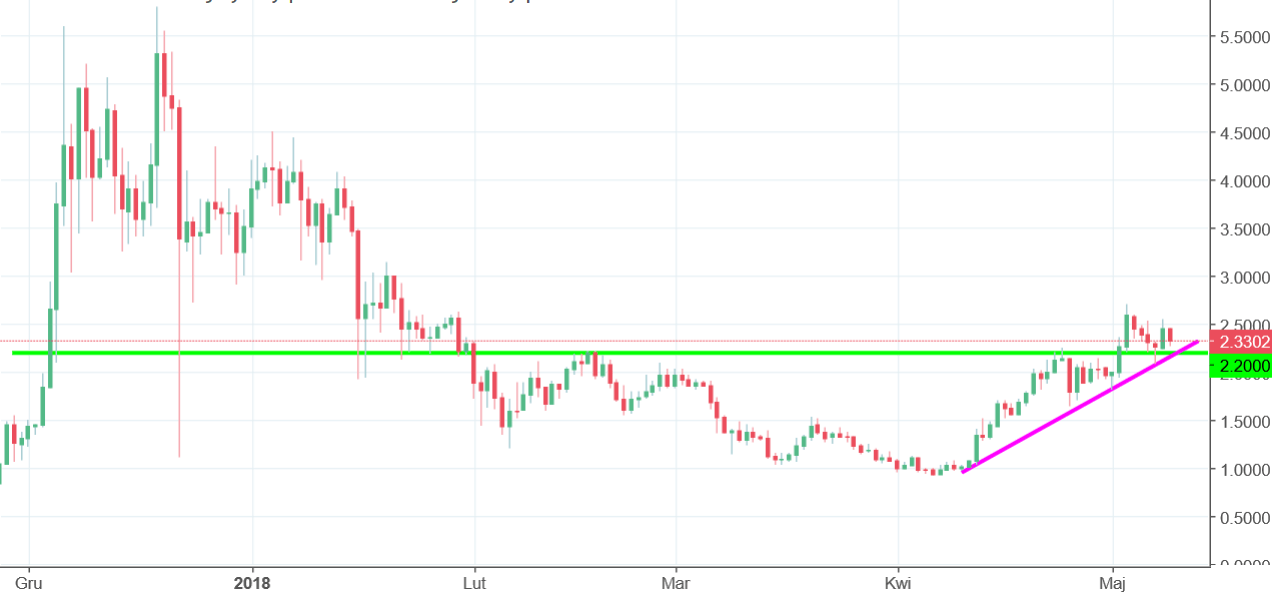
Current situation is also positive. IOTA broke the horizontal resistance on the 2,2 USD (green) and later used that as a support. In addition to that, we can see that the coin is using the mid-term up trendline (pink), which only strengthens the buy signal. On top of that, look at the candle from Monday, it is a very powerful hammer, which shows the bullish counter attack and a demand on lower levels. As long as we stay above the green area, the sentiment is definitely positive.


Comments (0 comment(s))