Litecoin Analysis – Target reached, broken and used as a resistance
We open new day with the analysis of the Litecoin. It has been a while here, as the previous piece was written on the 14th of August. That does not mean that our last analysis is outdated. Back in that day we were bearish and we continue to be bearish! By the way, speaking about our last article about the Litecoin…it was a great piece of work. Check out yourself:
„The target for the current downswing is around the 38 USD and chances that we will get there are quite high. These are the lows from the July and September 2017 and we should get there relatively easy. „
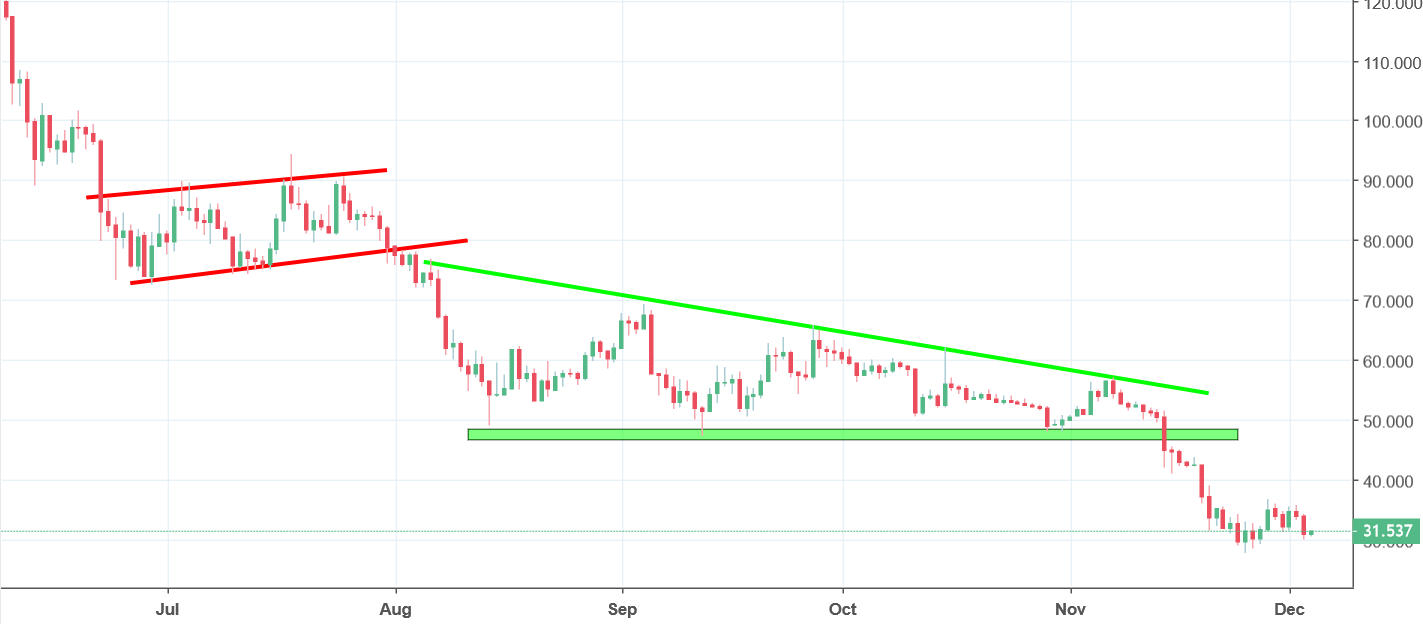
We wrote that, when the price was around 51 USD. Our target was reached on the 19th of November. The price got there quite easily and foremost, very technically. The main reason for the drop was the descending triangle pattern (green lines) that appeared on the chart at the end of summer and the beginning of autumn. 38 USD was broken and now we can say that it is playing a role of a resistance. The negative approach remains active, as long as we are below the green horizontal area. Chances for a further drop are very high.


Comments (0 comment(s))