Monero (XMR) Analysis – Breakout of the lower line of the triangle triggers a major sell signal

The last instrument of the day will be Monero. We also talked about this altcoin in May, the 2nd of May to be precise. The situation wasn’t looking so bad and the price actually had chances to climb higher. Although it was looking good, we warned our traders from the premature optimism:
“Before entering to the long trade with the both feet, remember that we are still under the long-term down trendline (pink). Only the breakout of that resistance should trigger us a legitimate, sustainable buy signal”
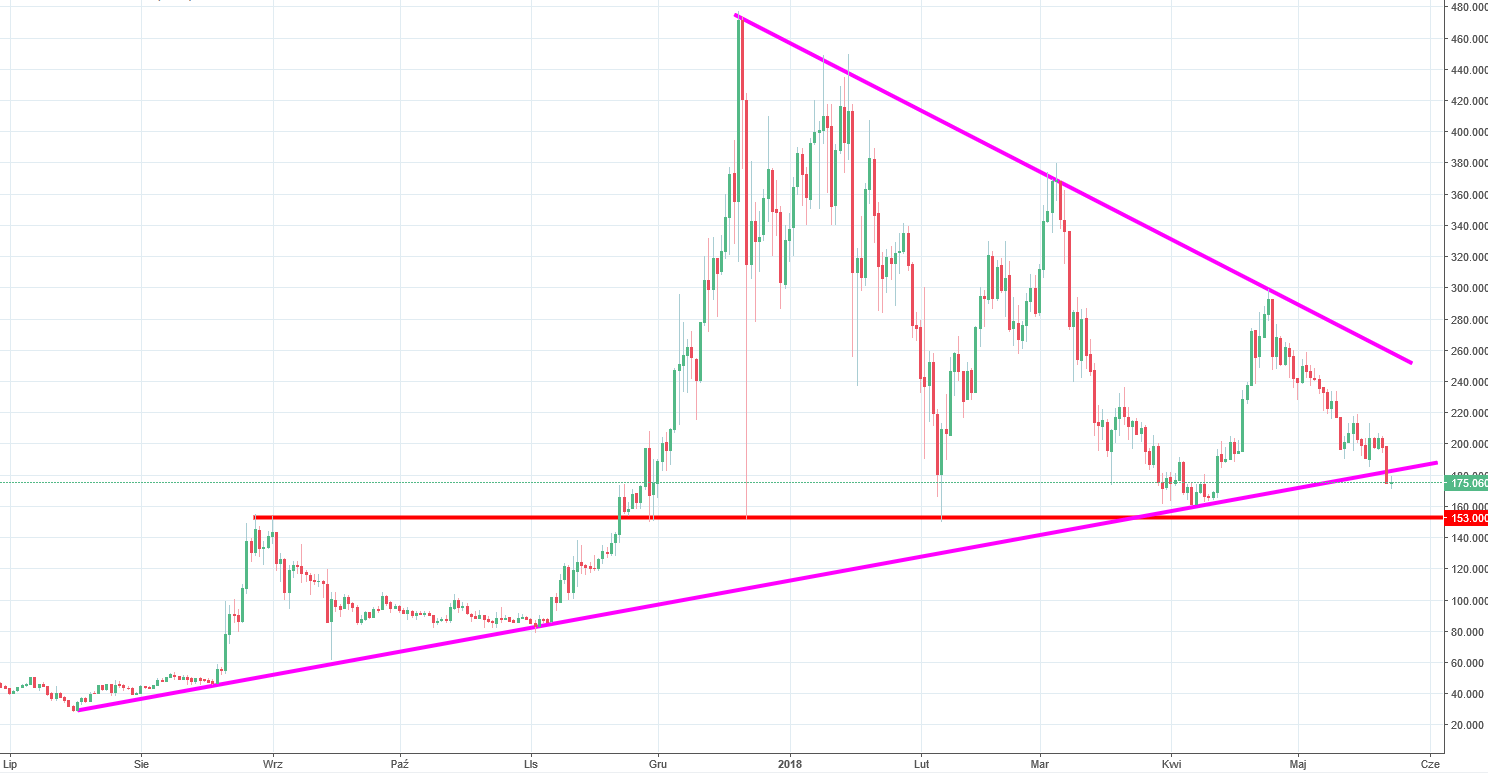
The down trendline was not broken, so there was no buy signal, simple is that. The price continued to go down and today, broke the long-term up trendline. Actually, that line and this one mentioned in the previous analysis are both the resistances and supports of the big symmetric triangle pattern.
Monero escaped from the triangle yesterday, triggering a major sell signal. The first target is relatively close and is are around the 153 USD (red line). We should get there easily. The triangle formation is huge so it promotes even a bigger drop so the target may be way below the psychological support on the 100 USD.


Comments (0 comment(s))